
Applications & Products
GIS Visualizer
GGIS Visualizer provides an easy way to visualize geographic data on 40+ base maps. Supported formats: GeoJSON, GPX, IGC, KML, Shapefile, TopoJSON, WKT, etc.
Especially, it supports the unique POINTS format: simply a set of points, no any data structure required at all!
- Four ways to import vector data: File, URL, Text, and Drag-and-Drop.
- Find elevation (AMSL) at any spot all over the world.
- Measuring: get length of any objects, and area of any polygons on the map.
- Export any vector layer as one of the four formats: GeoJSON, GPX, KML, WKT.
Furthermore, it can show feature attributes, mouse position lat/long, map graticule, etc.
Launch GIS Visualizer More Info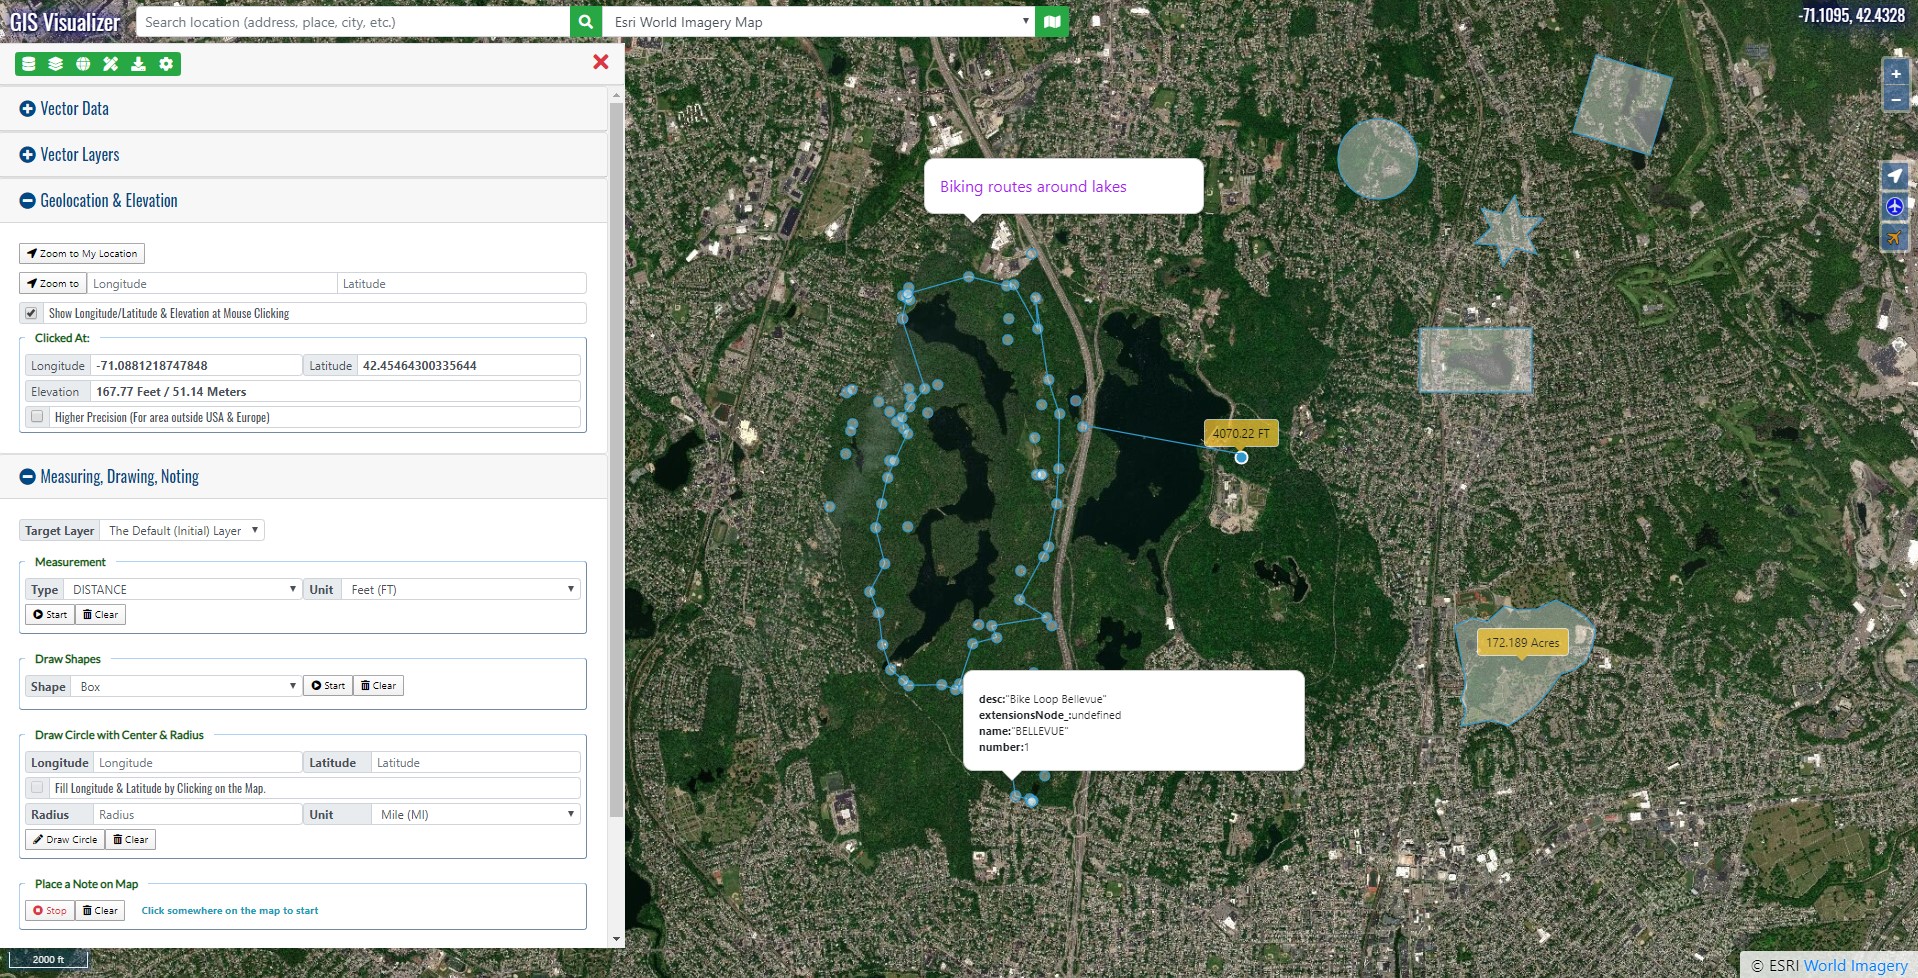 click the image above to view a larger one
- You can easily place some notes on the map, as in the screenshot above.
LinkBasket
LLinkBaset has two versions: an Android app and a PWA (Progressive Web App). It could replace most of your news moble apps if it's not all. With Linkbasket, you have one place to read daily news from all over the world in your favorite devices: phone, pad, PC, Mac, etc.
- Hundreds of news sites all over the world in one place.
- A fully functional bookmark management syatem (Android only).
- Multiple languages support - different language has different news content.
 Launch LinkBasket PWA

Flight Visualizer (Version 0.3)
FFlight Visualizer tracks flights/aircraft in real time on 30+ base maps. Eventually, it will support 3D maps, and integrate with Airport Visualizer and TFR Visualizer.
- Track all flights/aircraft on maps
- Track selected flights/aircraft
- Show the traveling direction of flights/aircraft
- Show the details of each flights/aircraft (time, long/lat, altitude, velocy, etc.)
- Display different icons for flights/aircraft in the air and on the ground.
If you have any suggestions/comments on Flight Visualizer, please Let Us Know.
Launch Flight Visualizer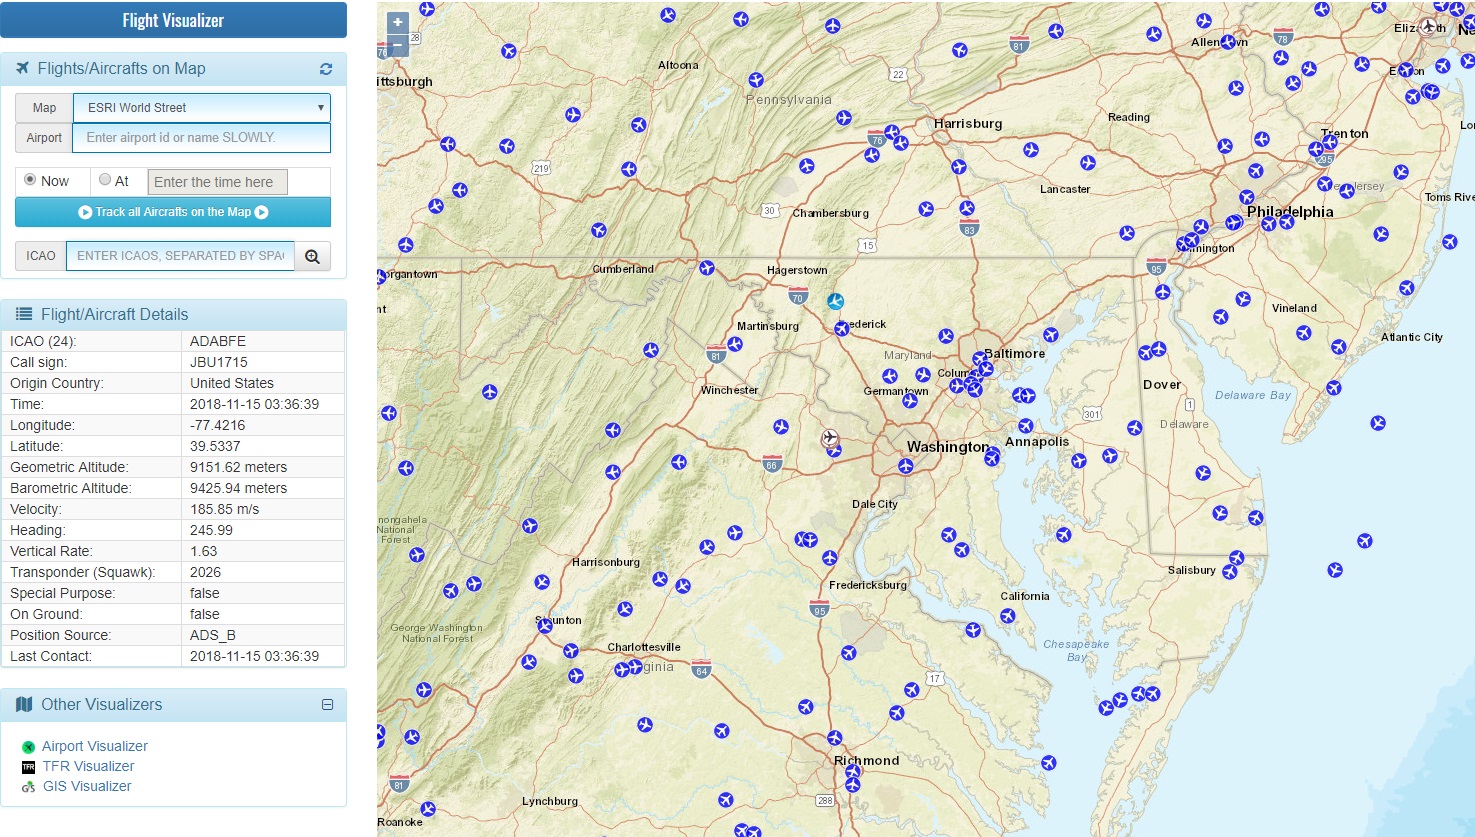 click the image above to view a larger one
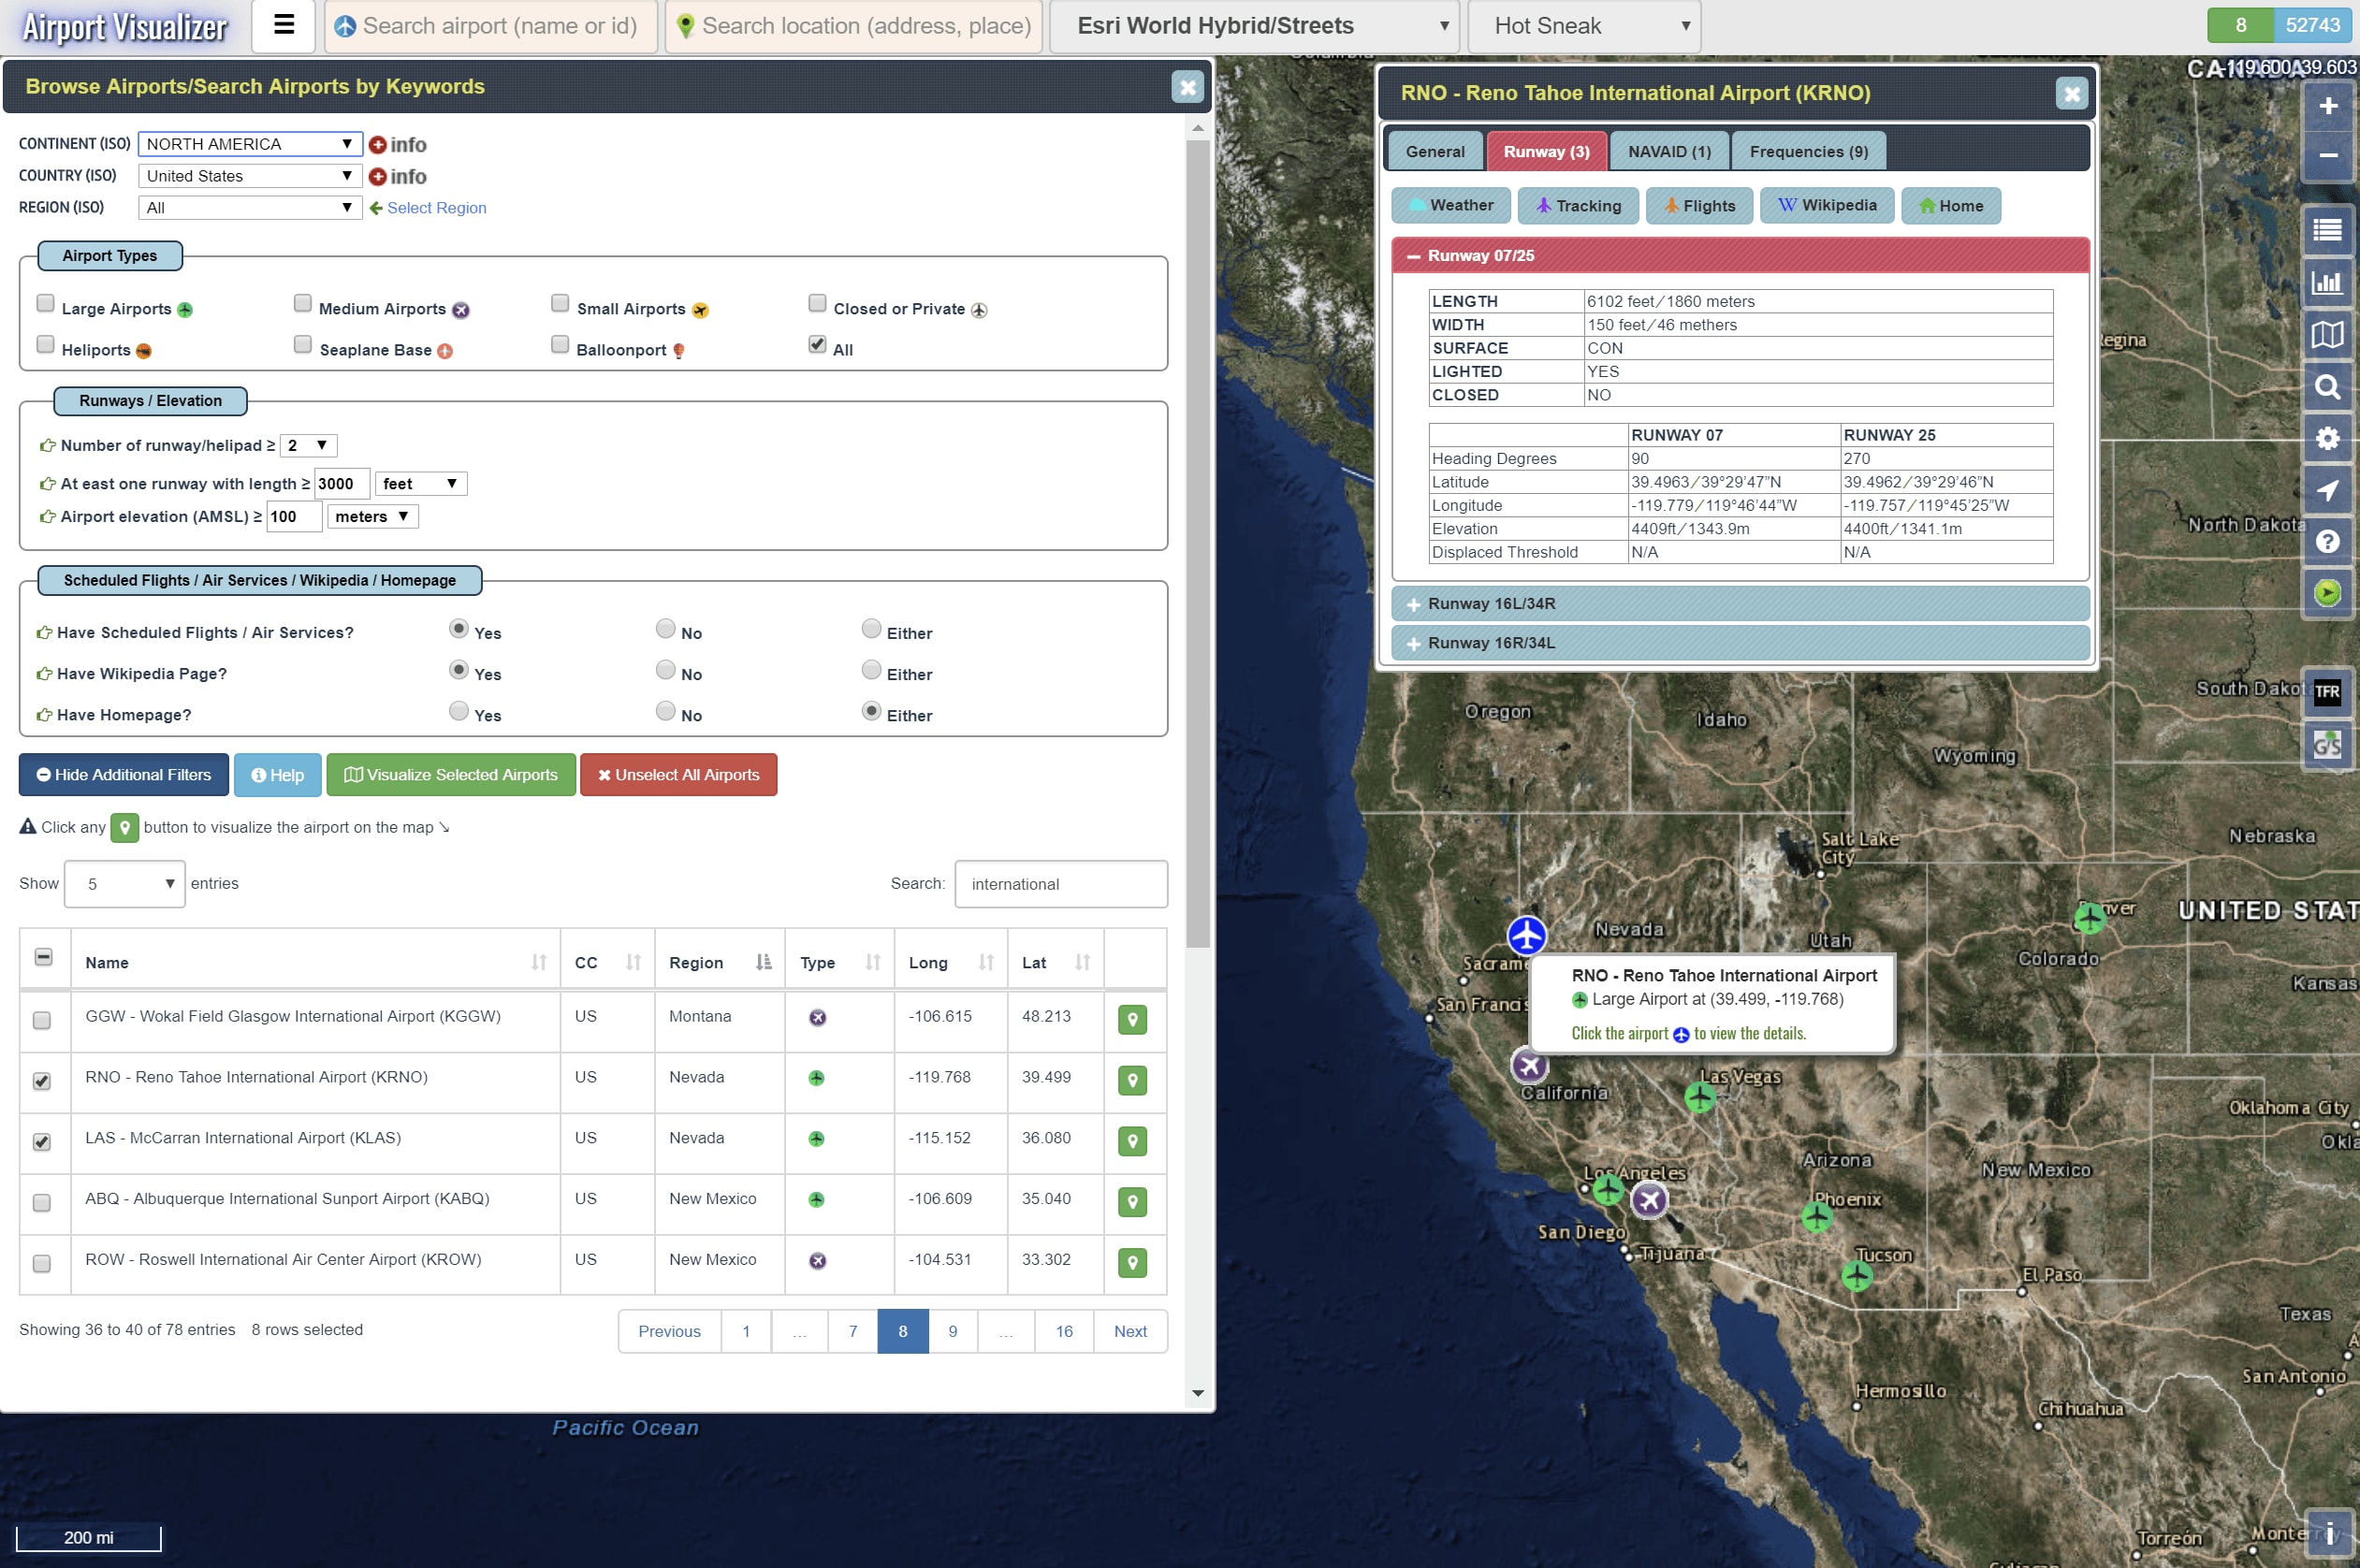
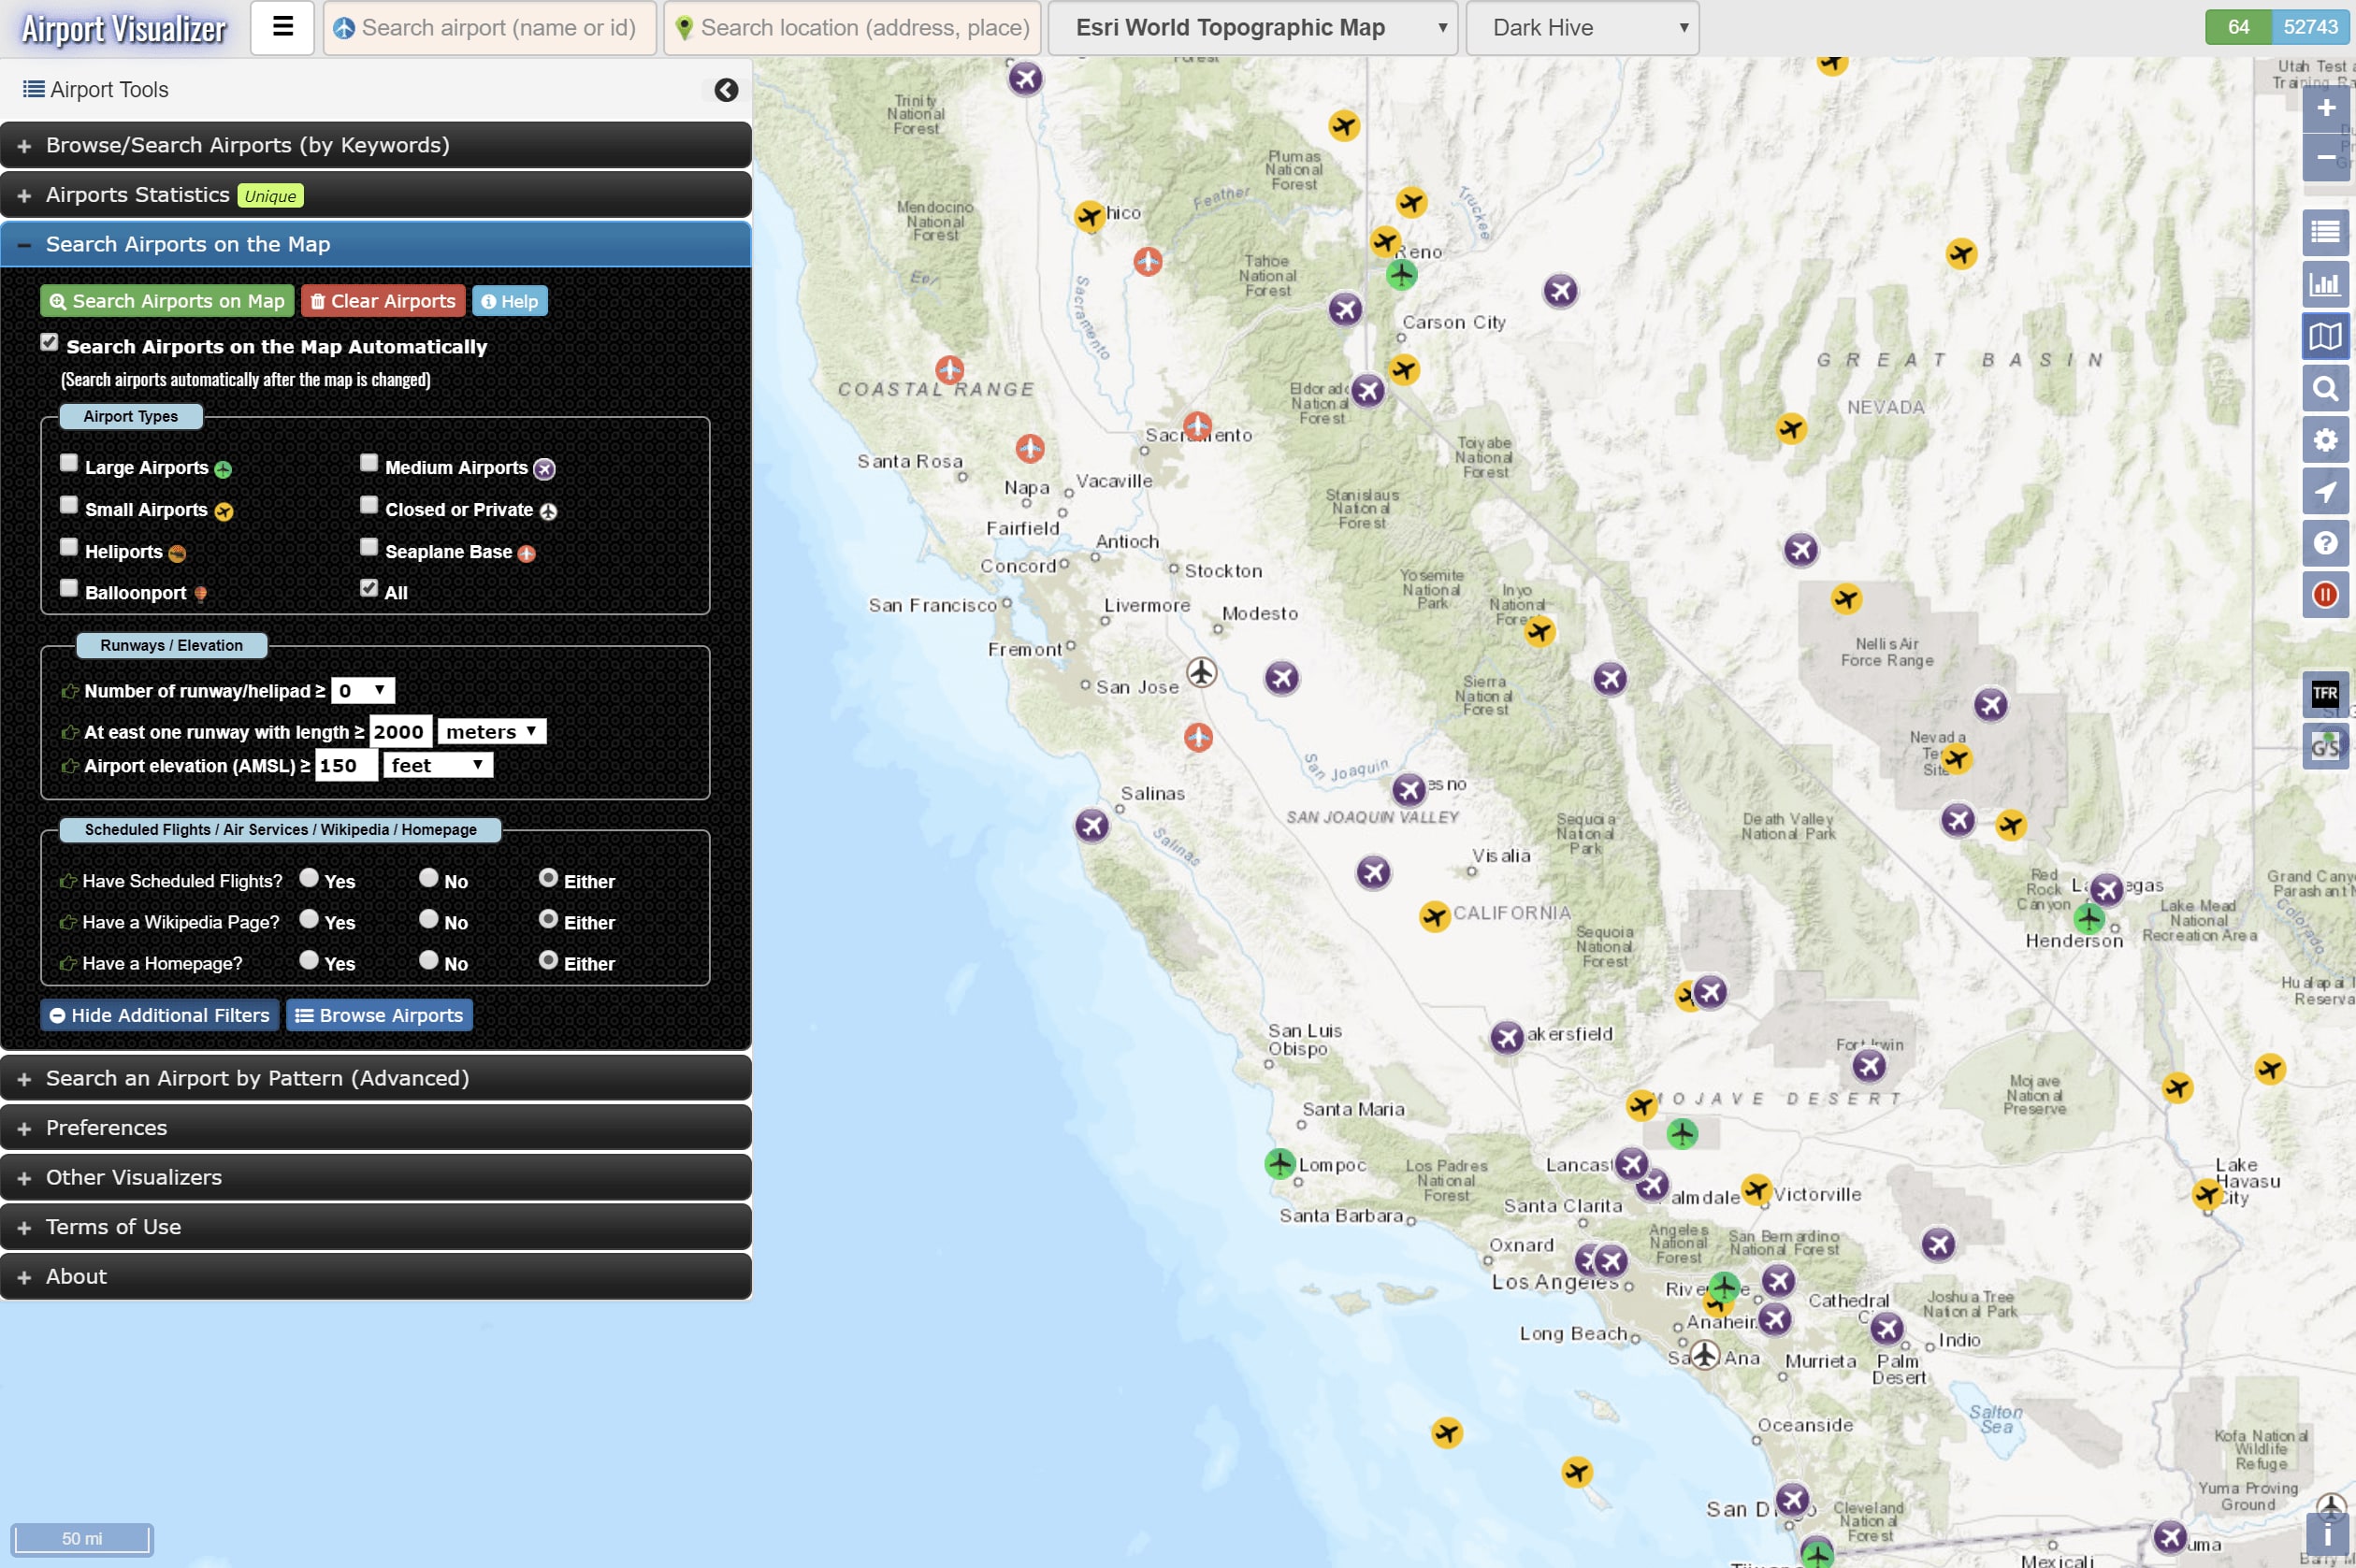
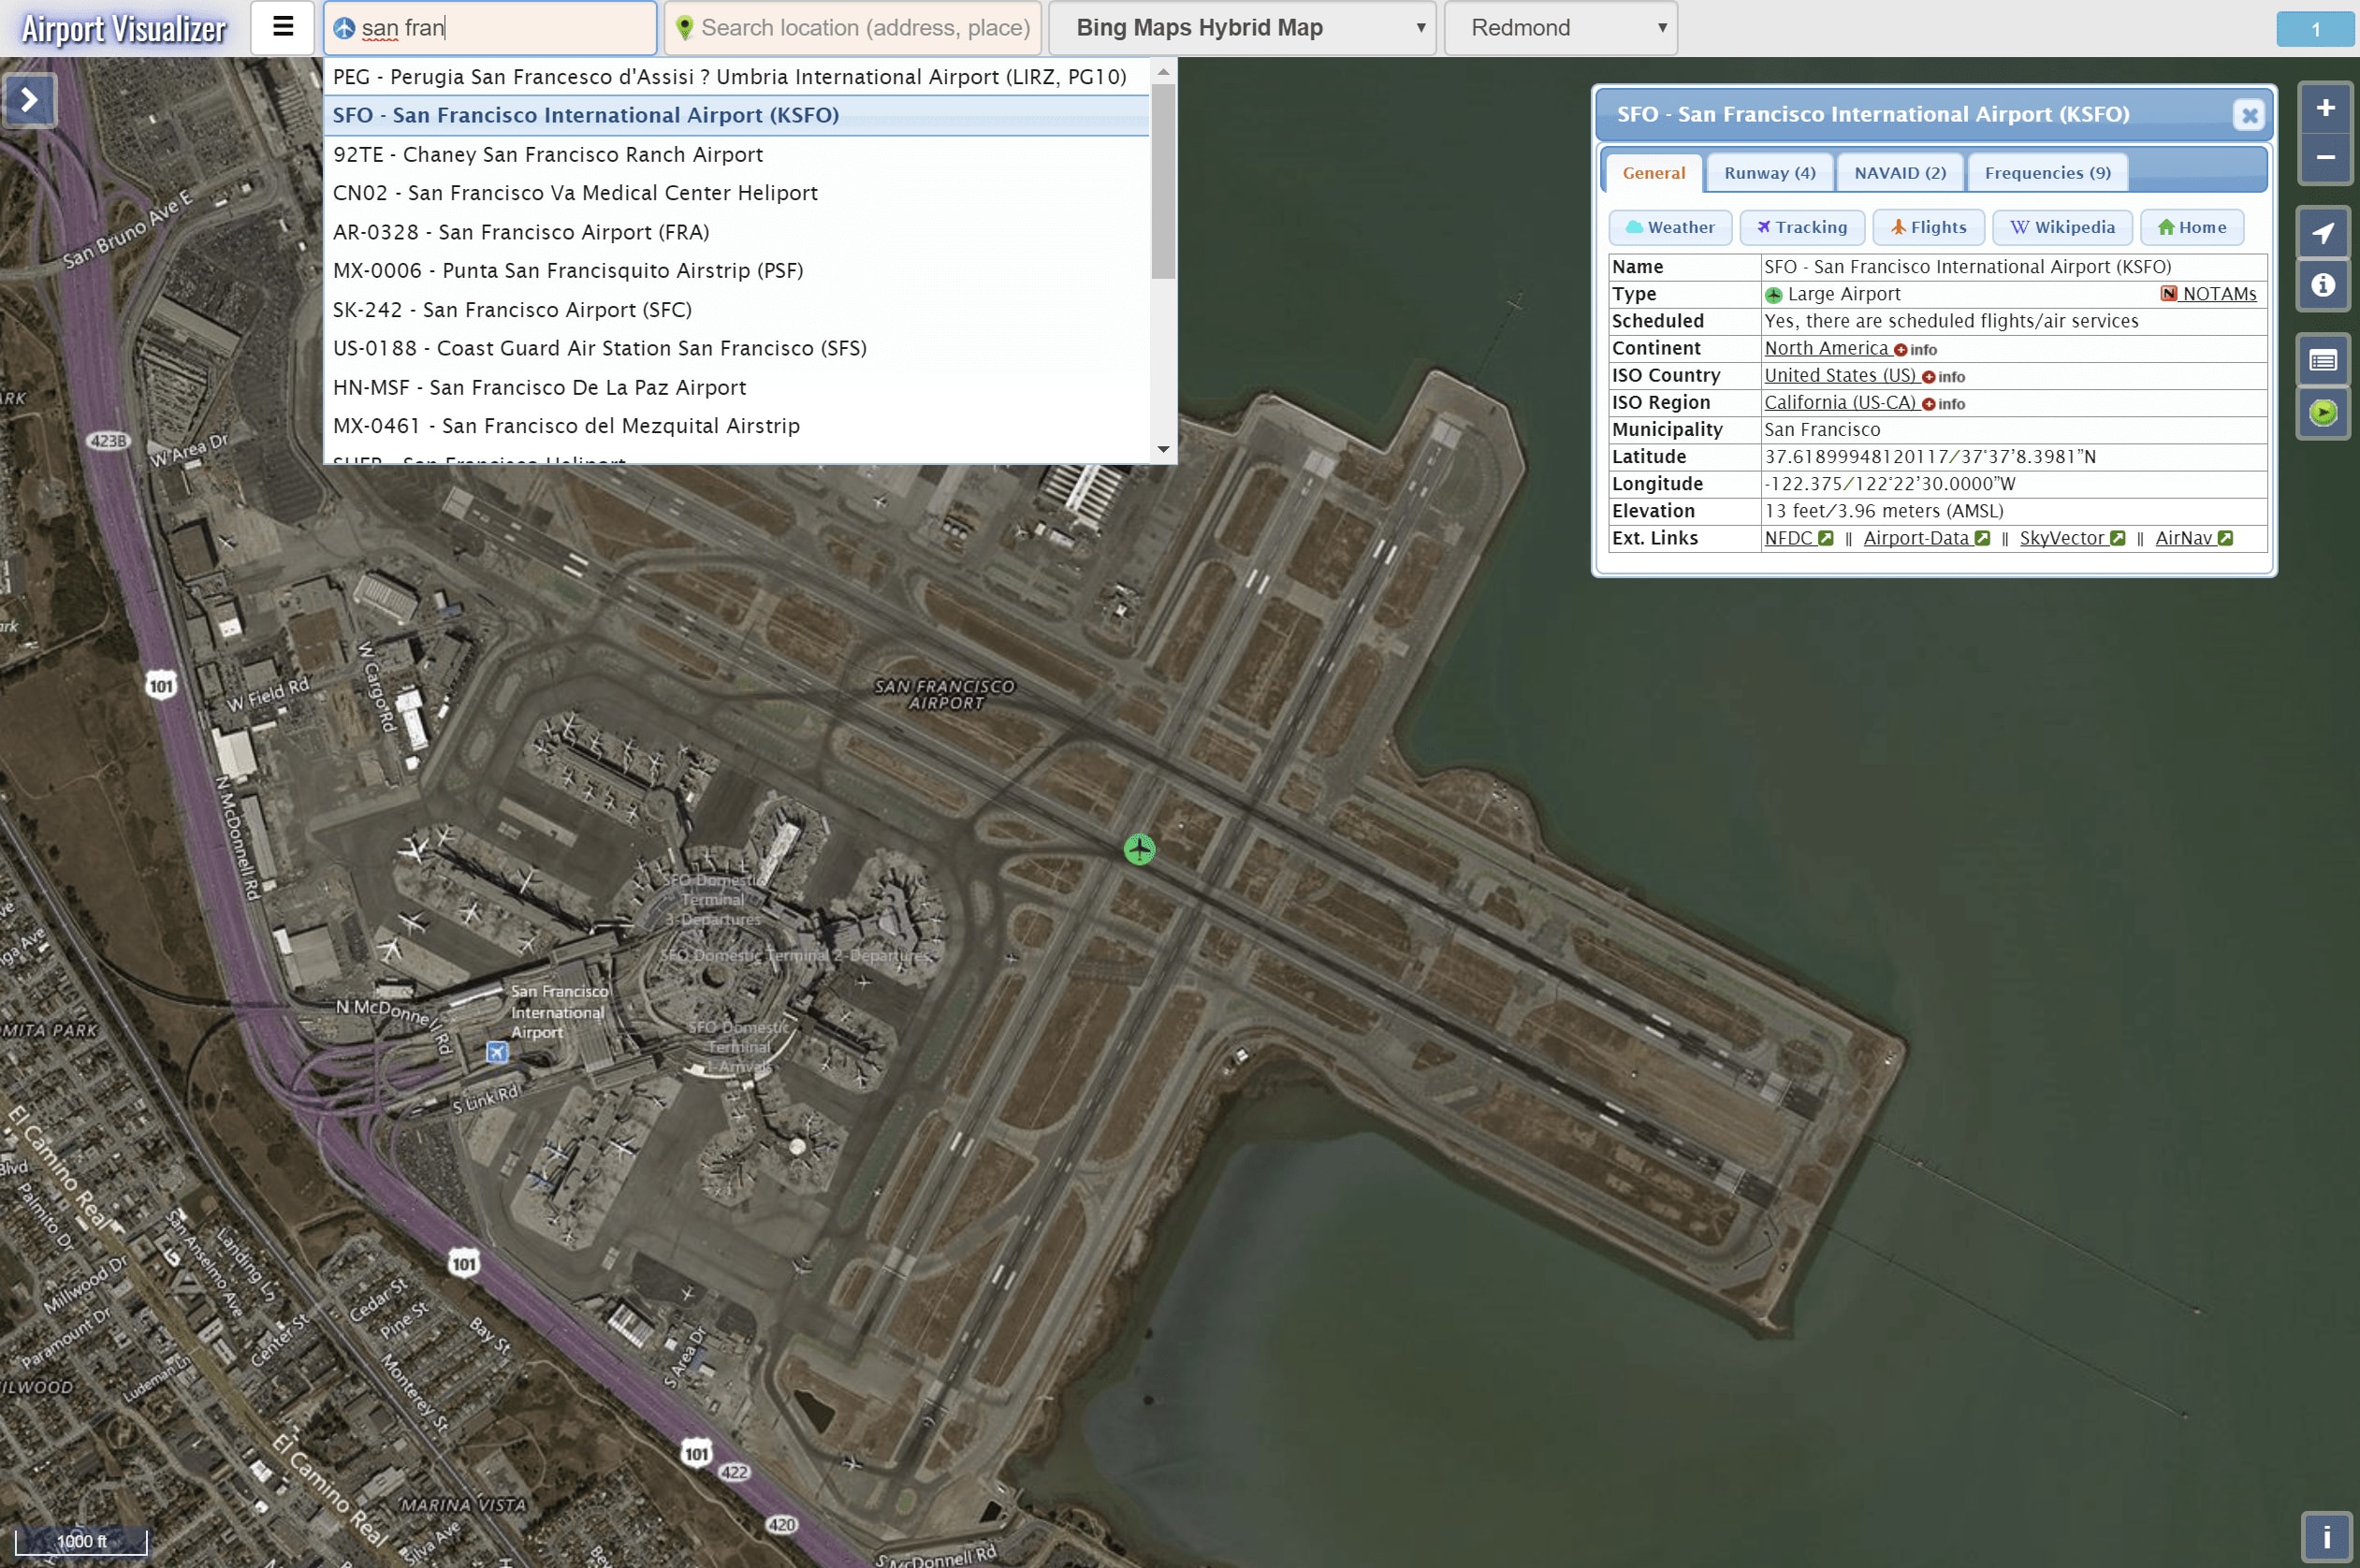
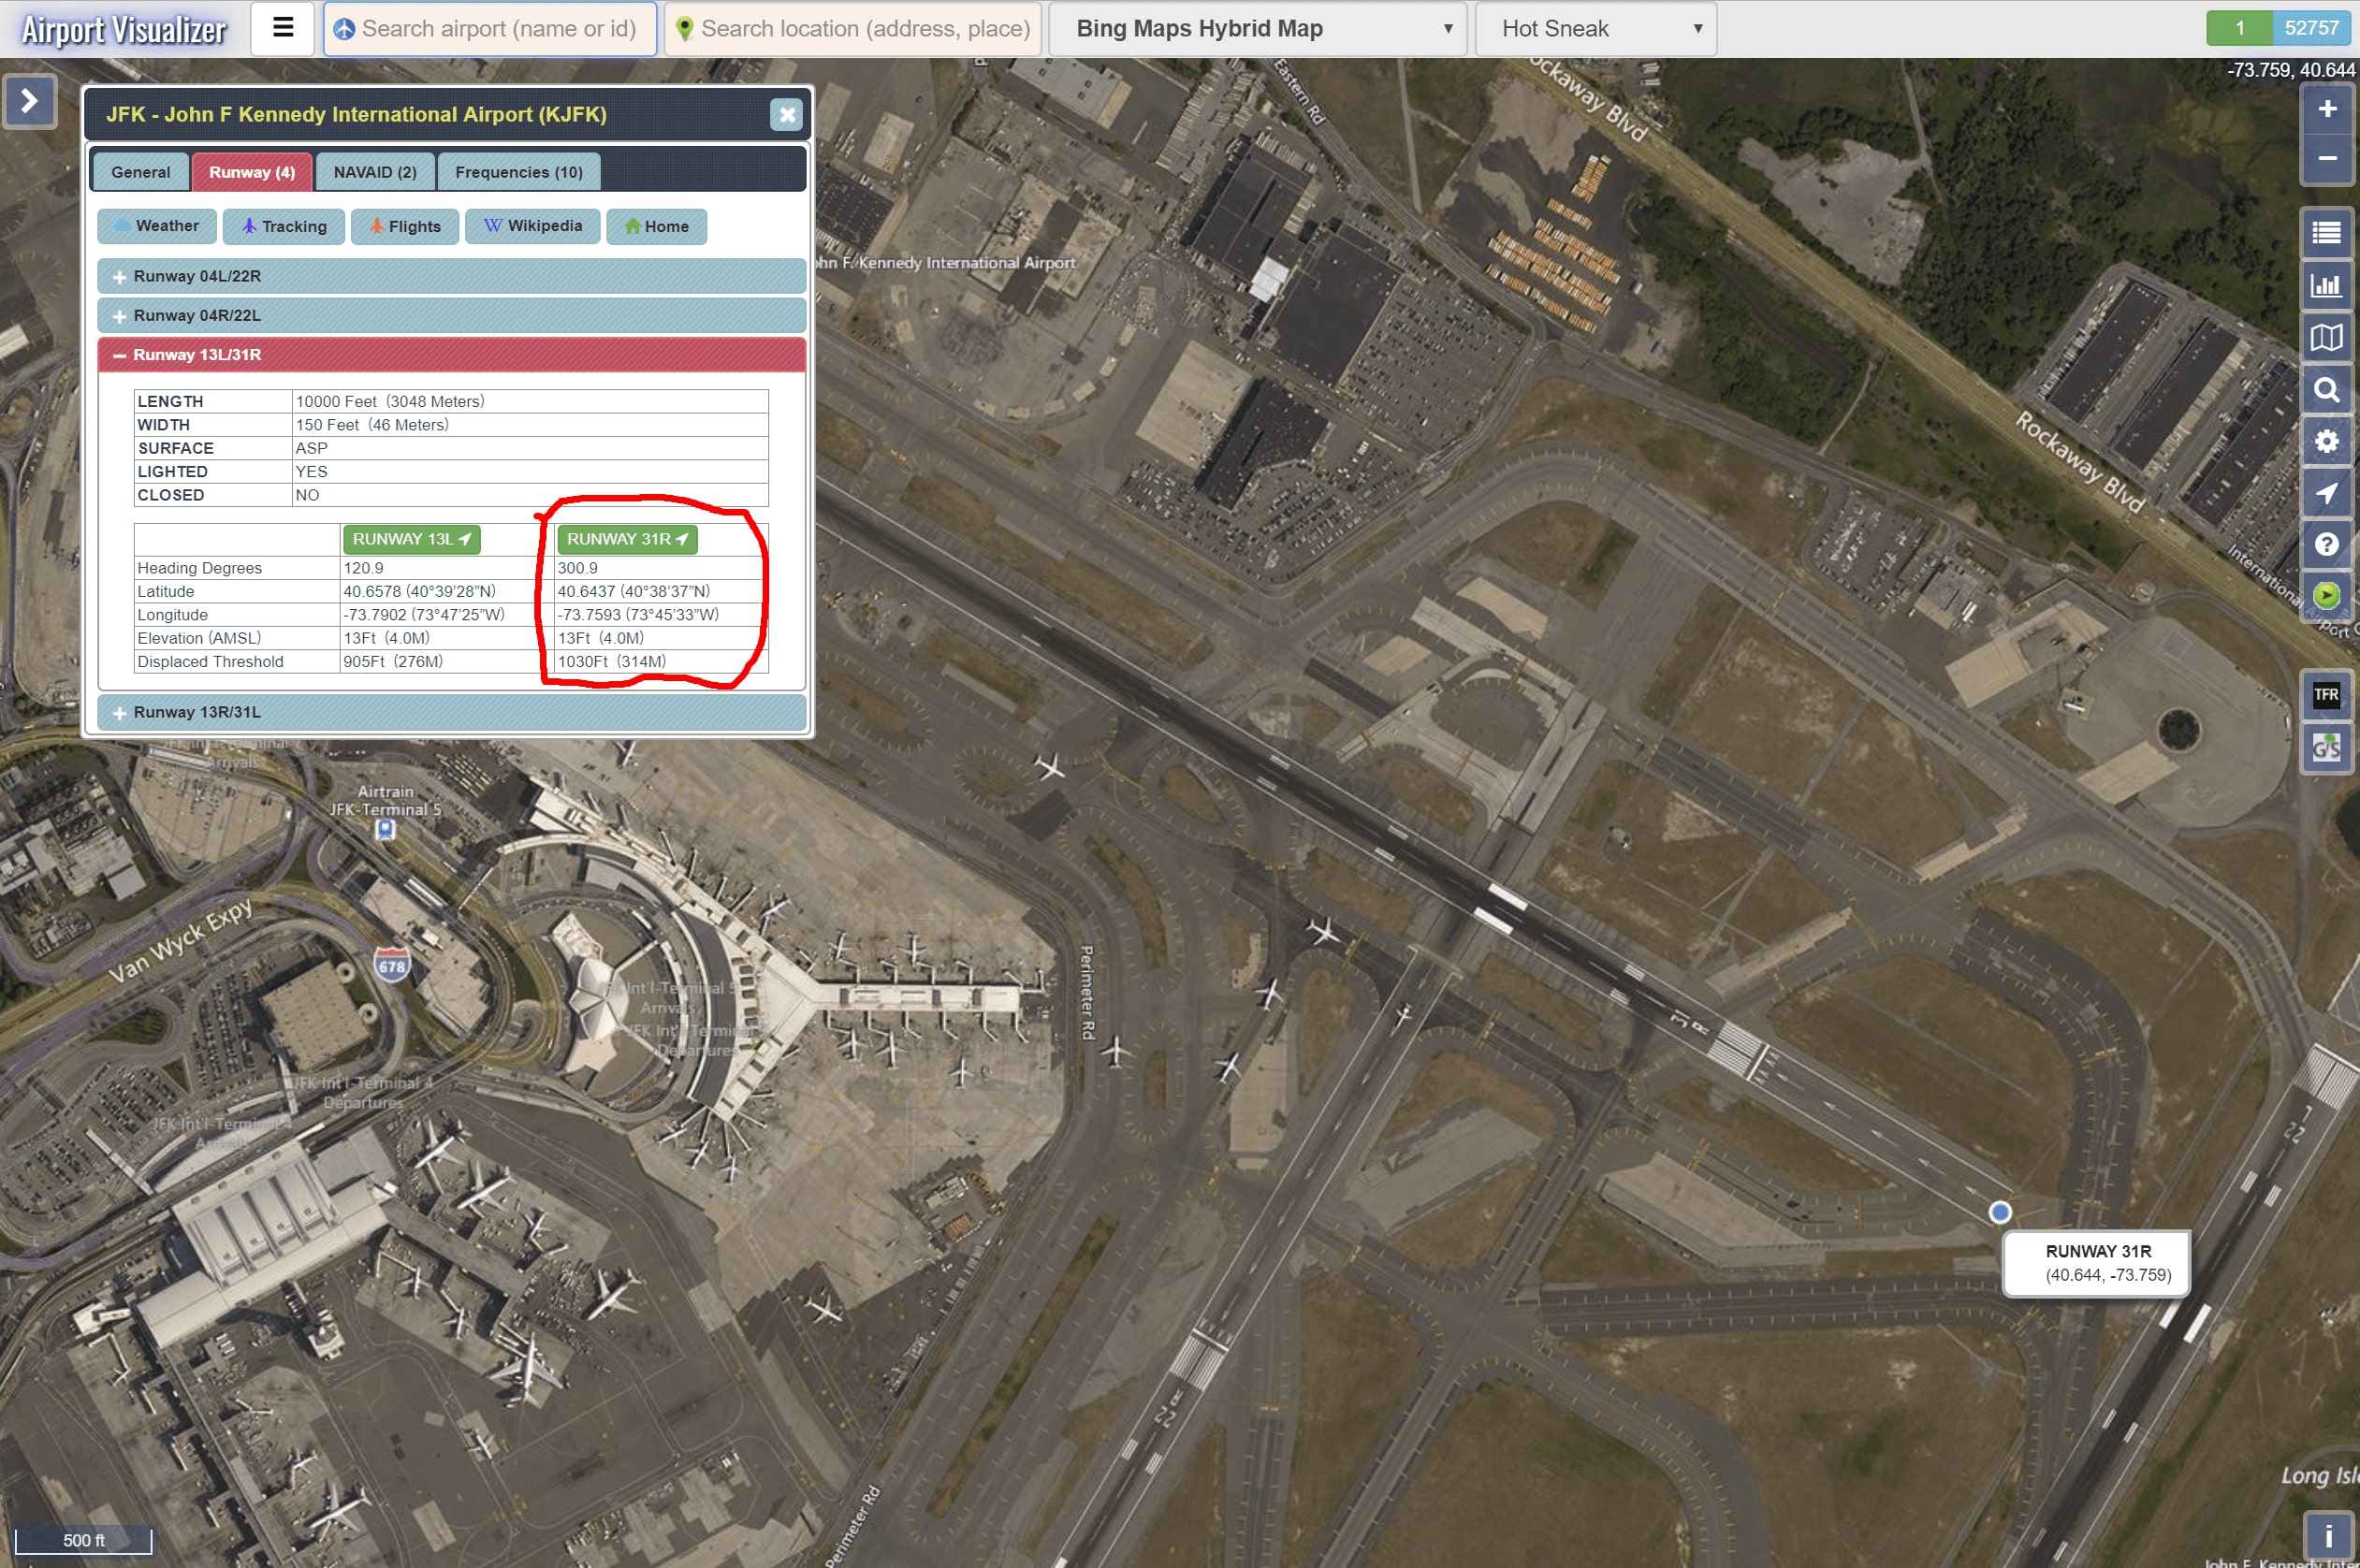
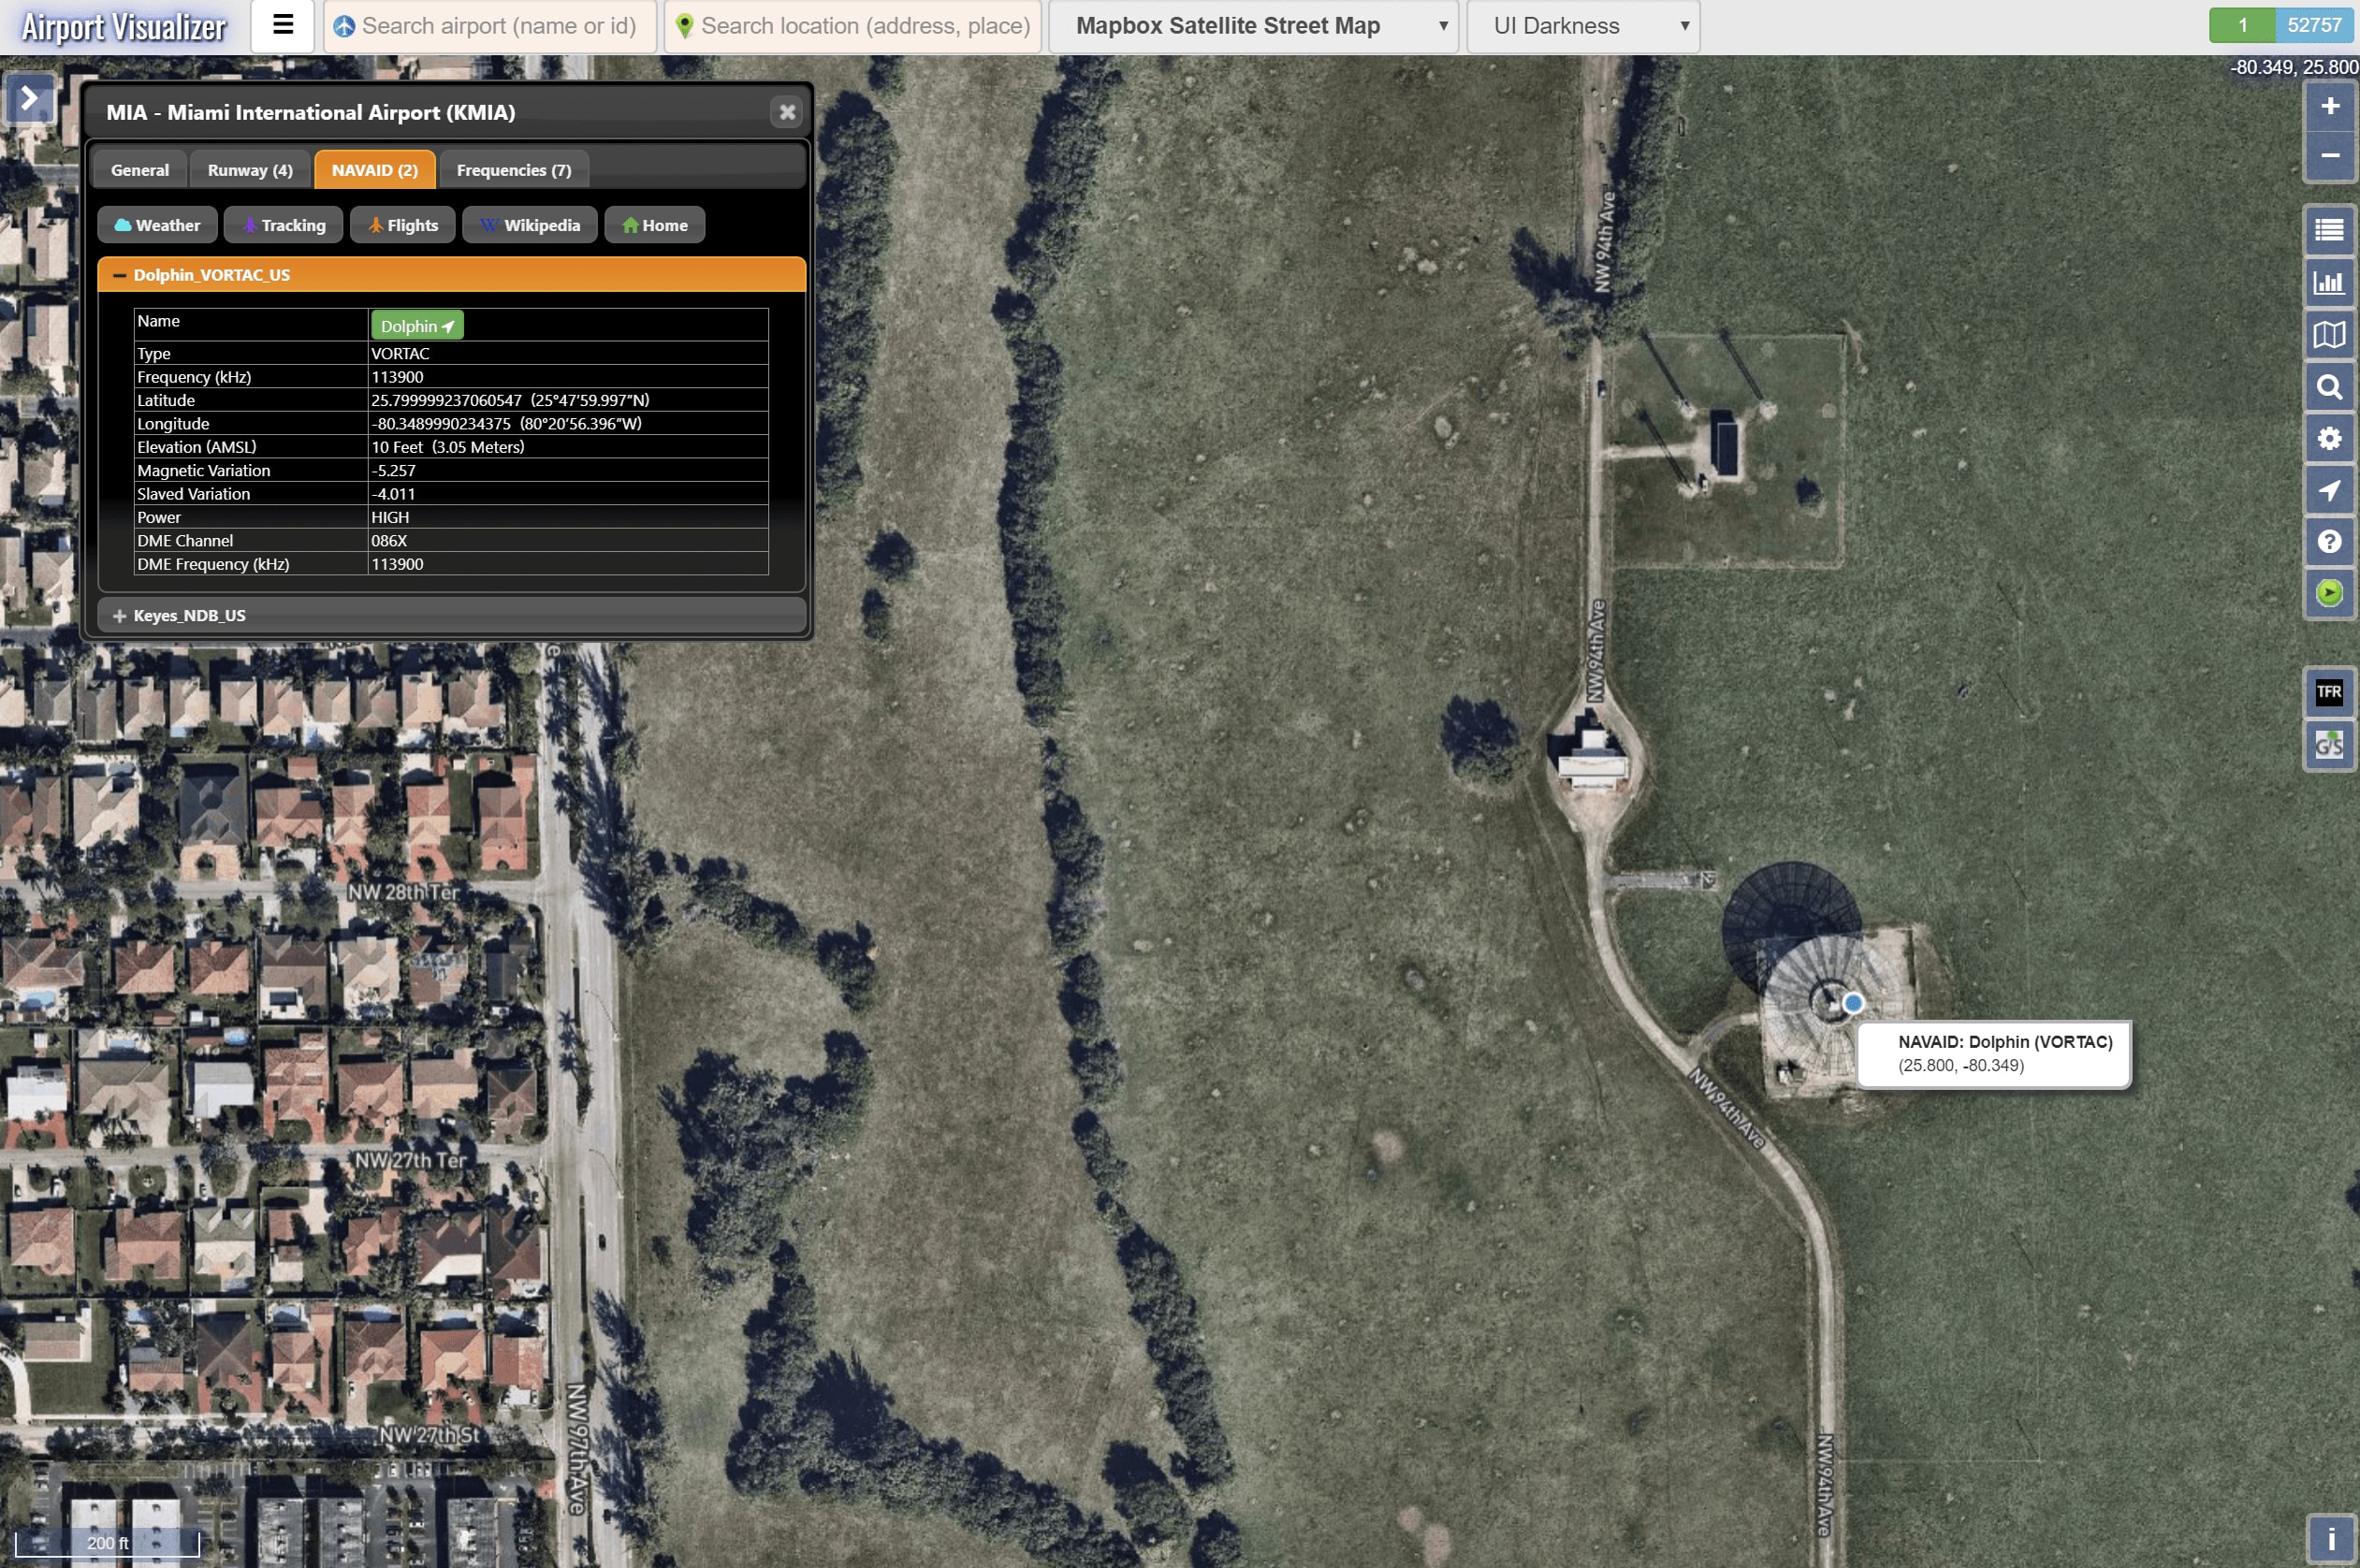
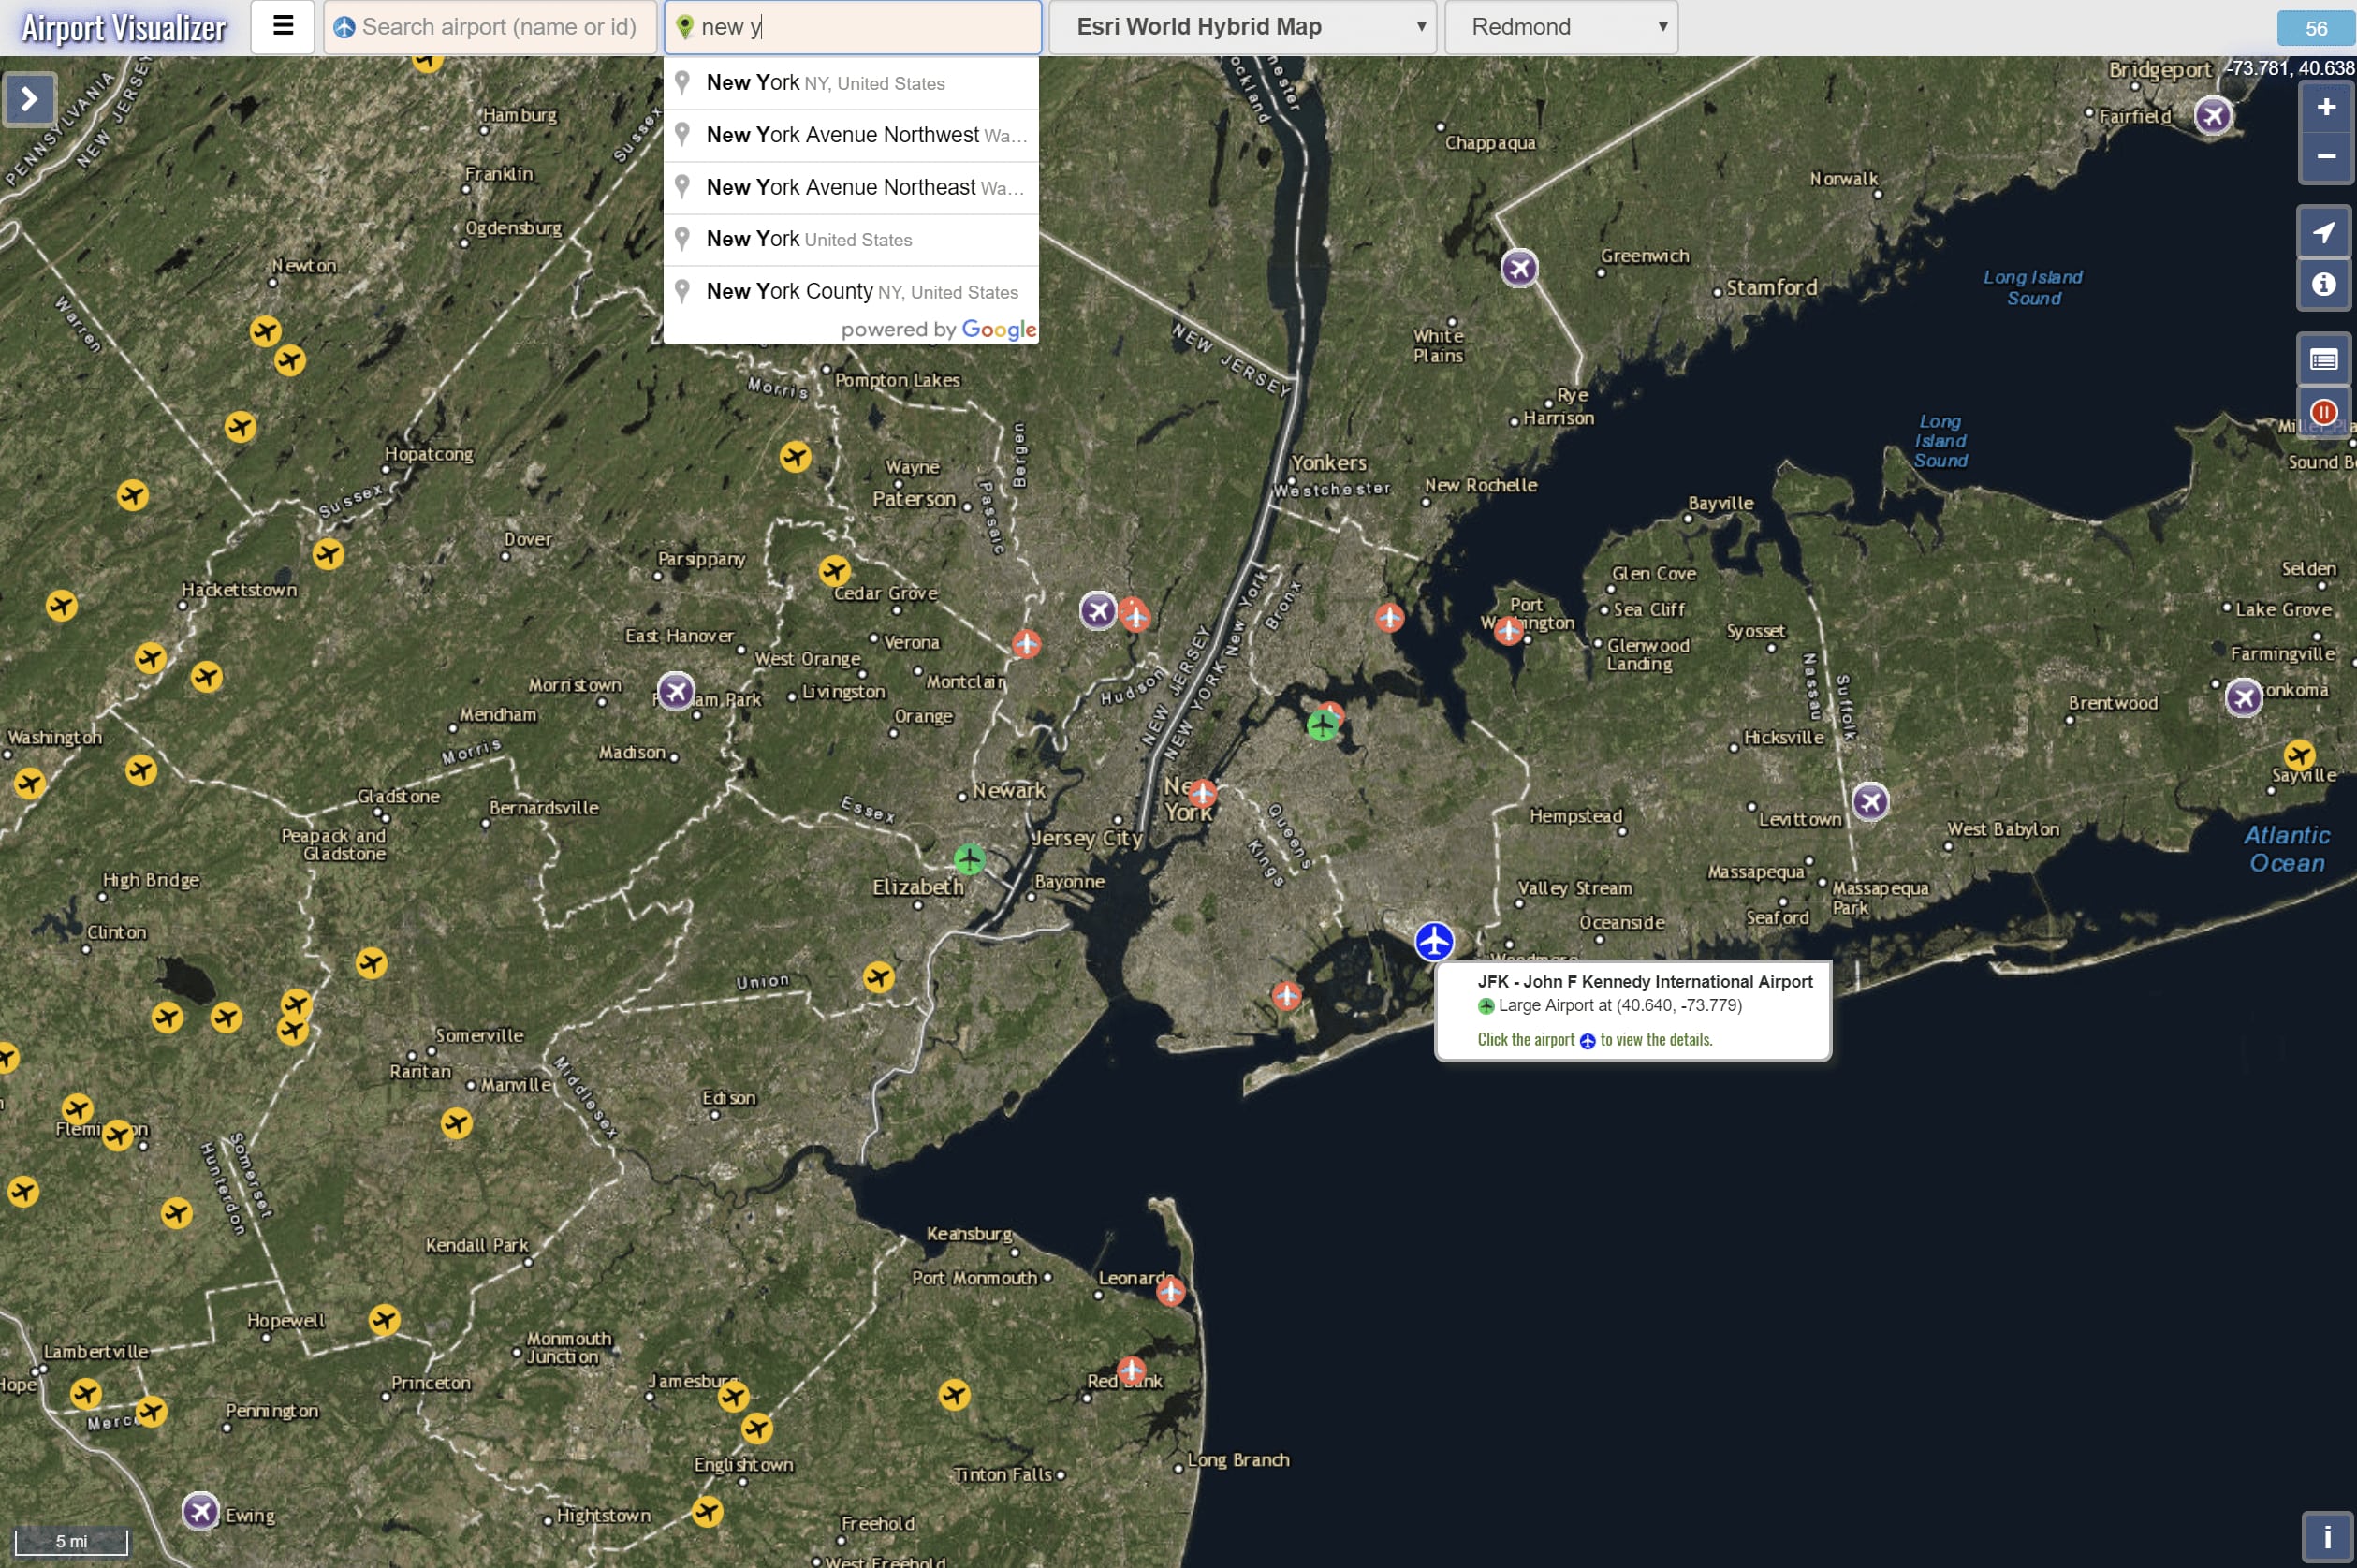
Airport Visualizer
AAirport Visualizer provides an innovative, map-oriented way to explore 51345 airports all over the world on 30+ base maps. It connects to all airport related information: Runways, Weather, Flights, Wikipedia, NOTAM, NAVAIDs, Frequencies, etc.
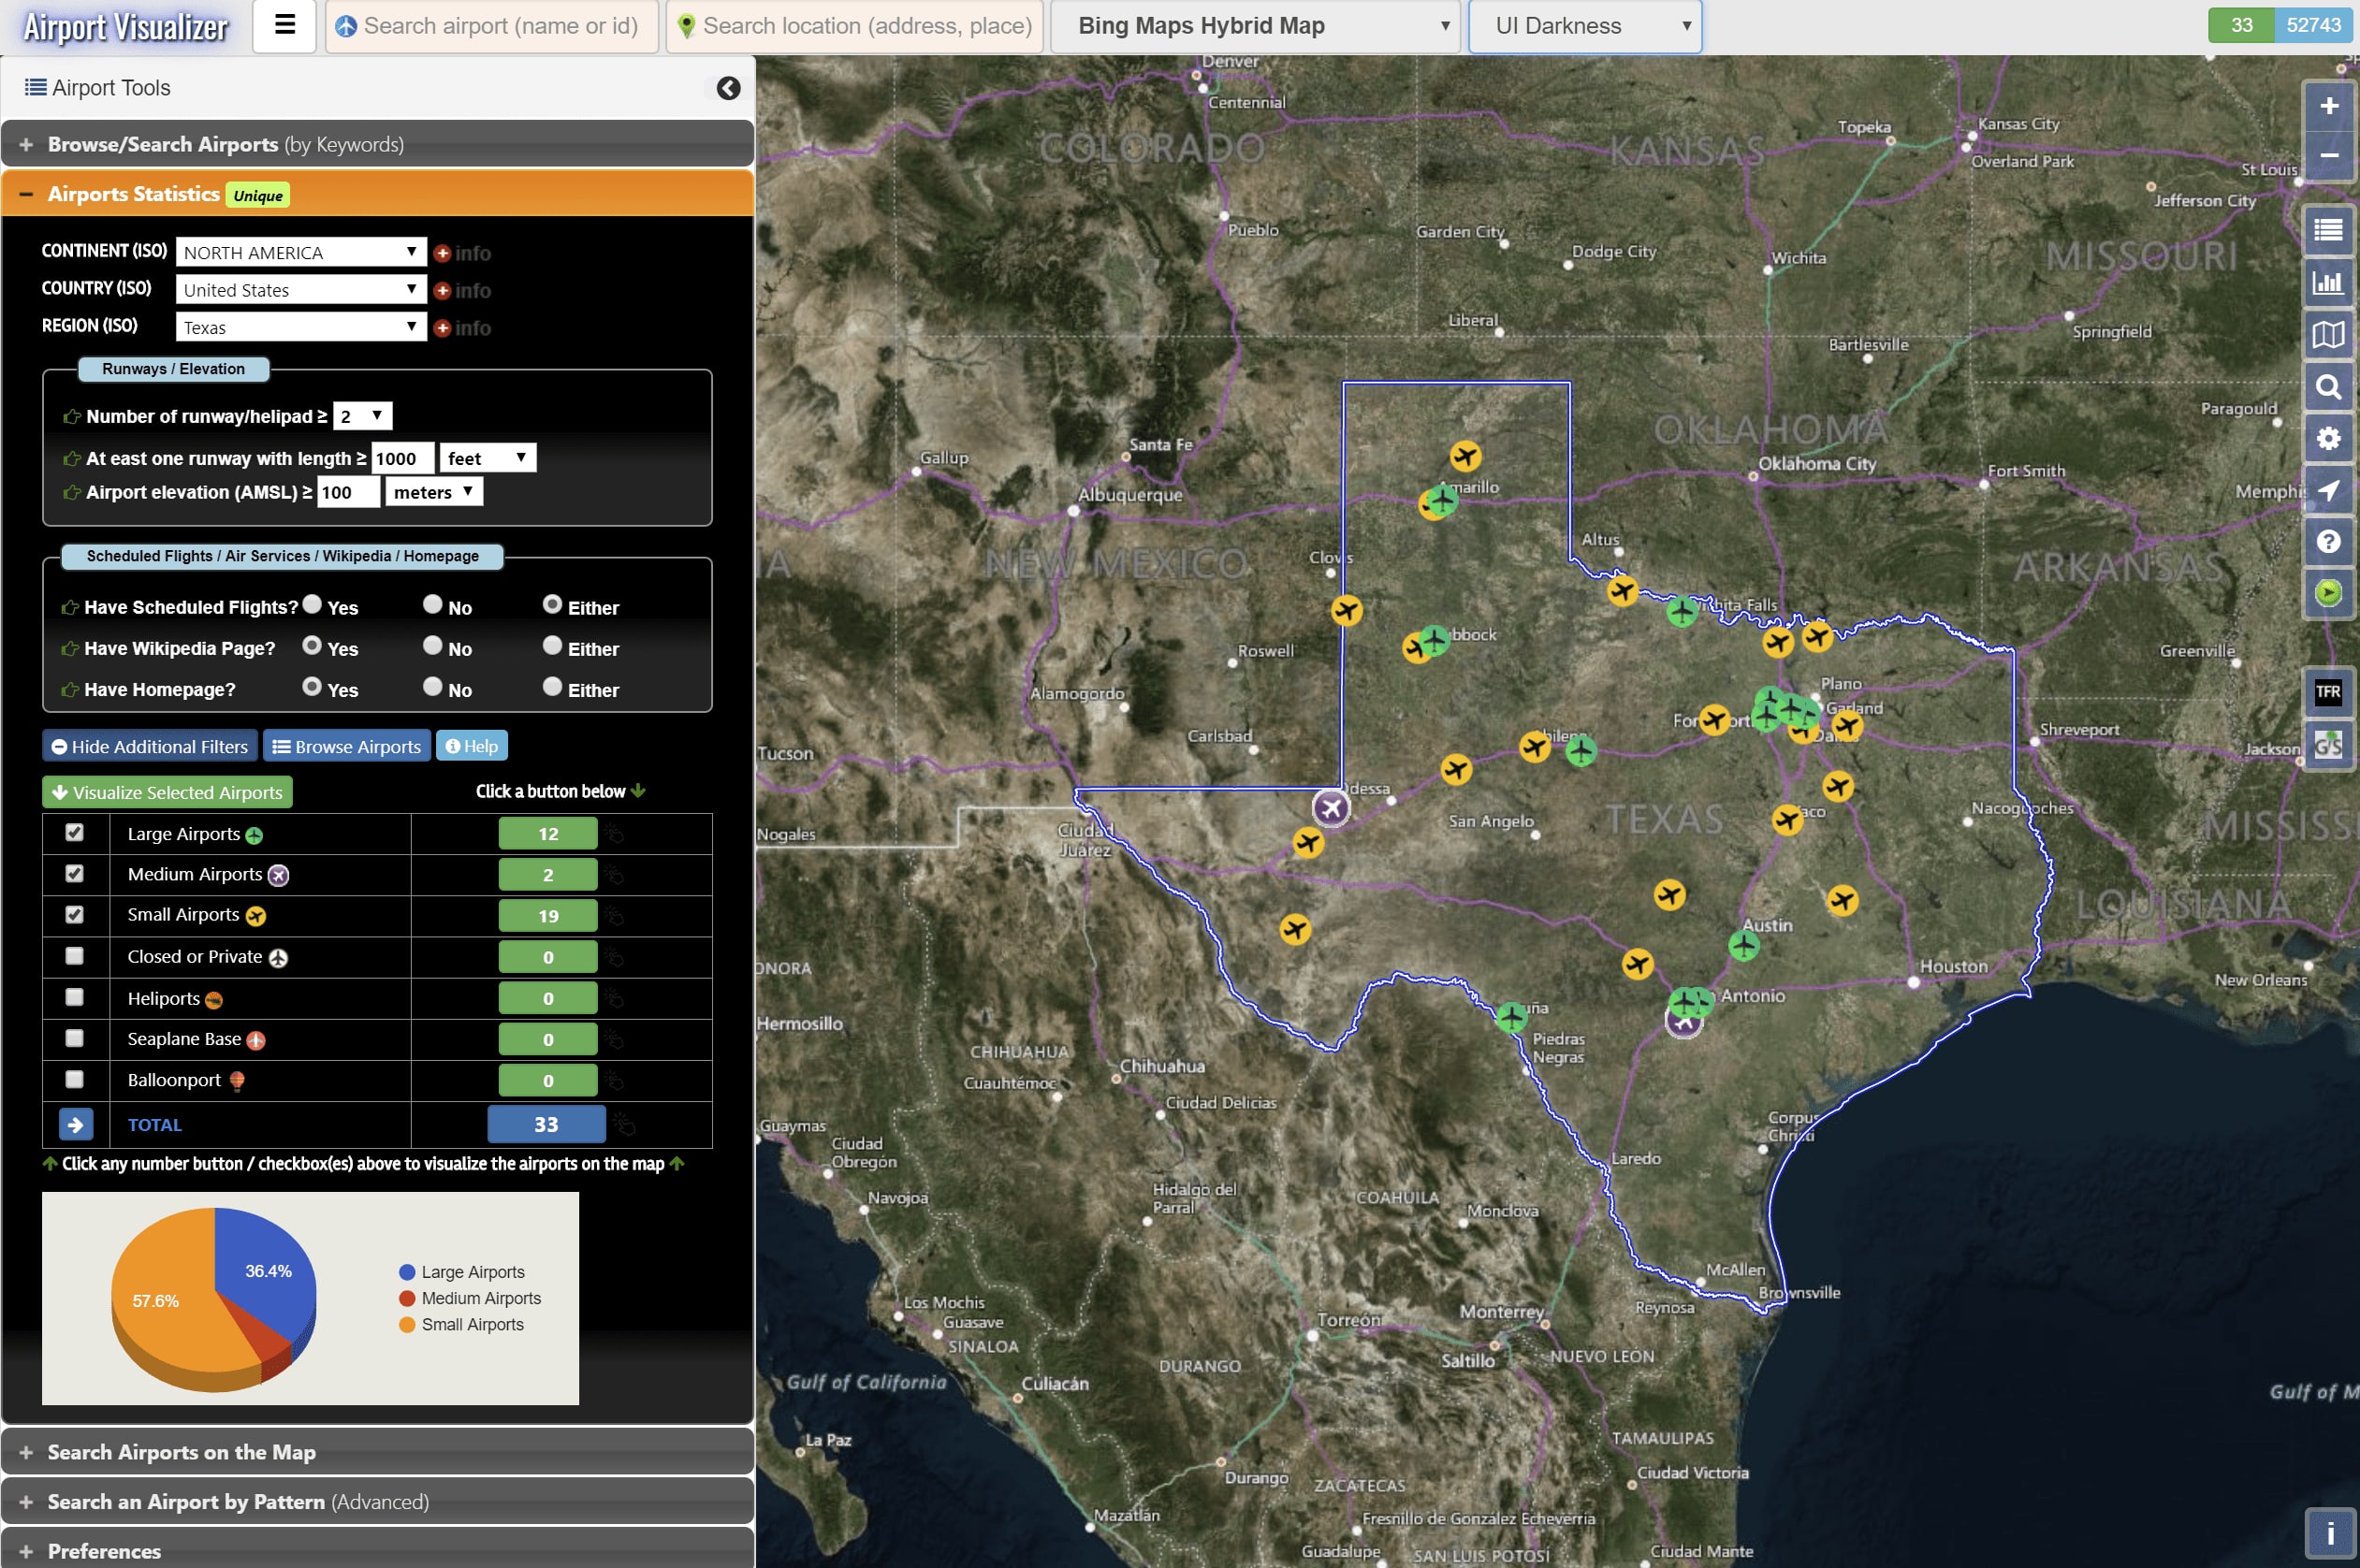
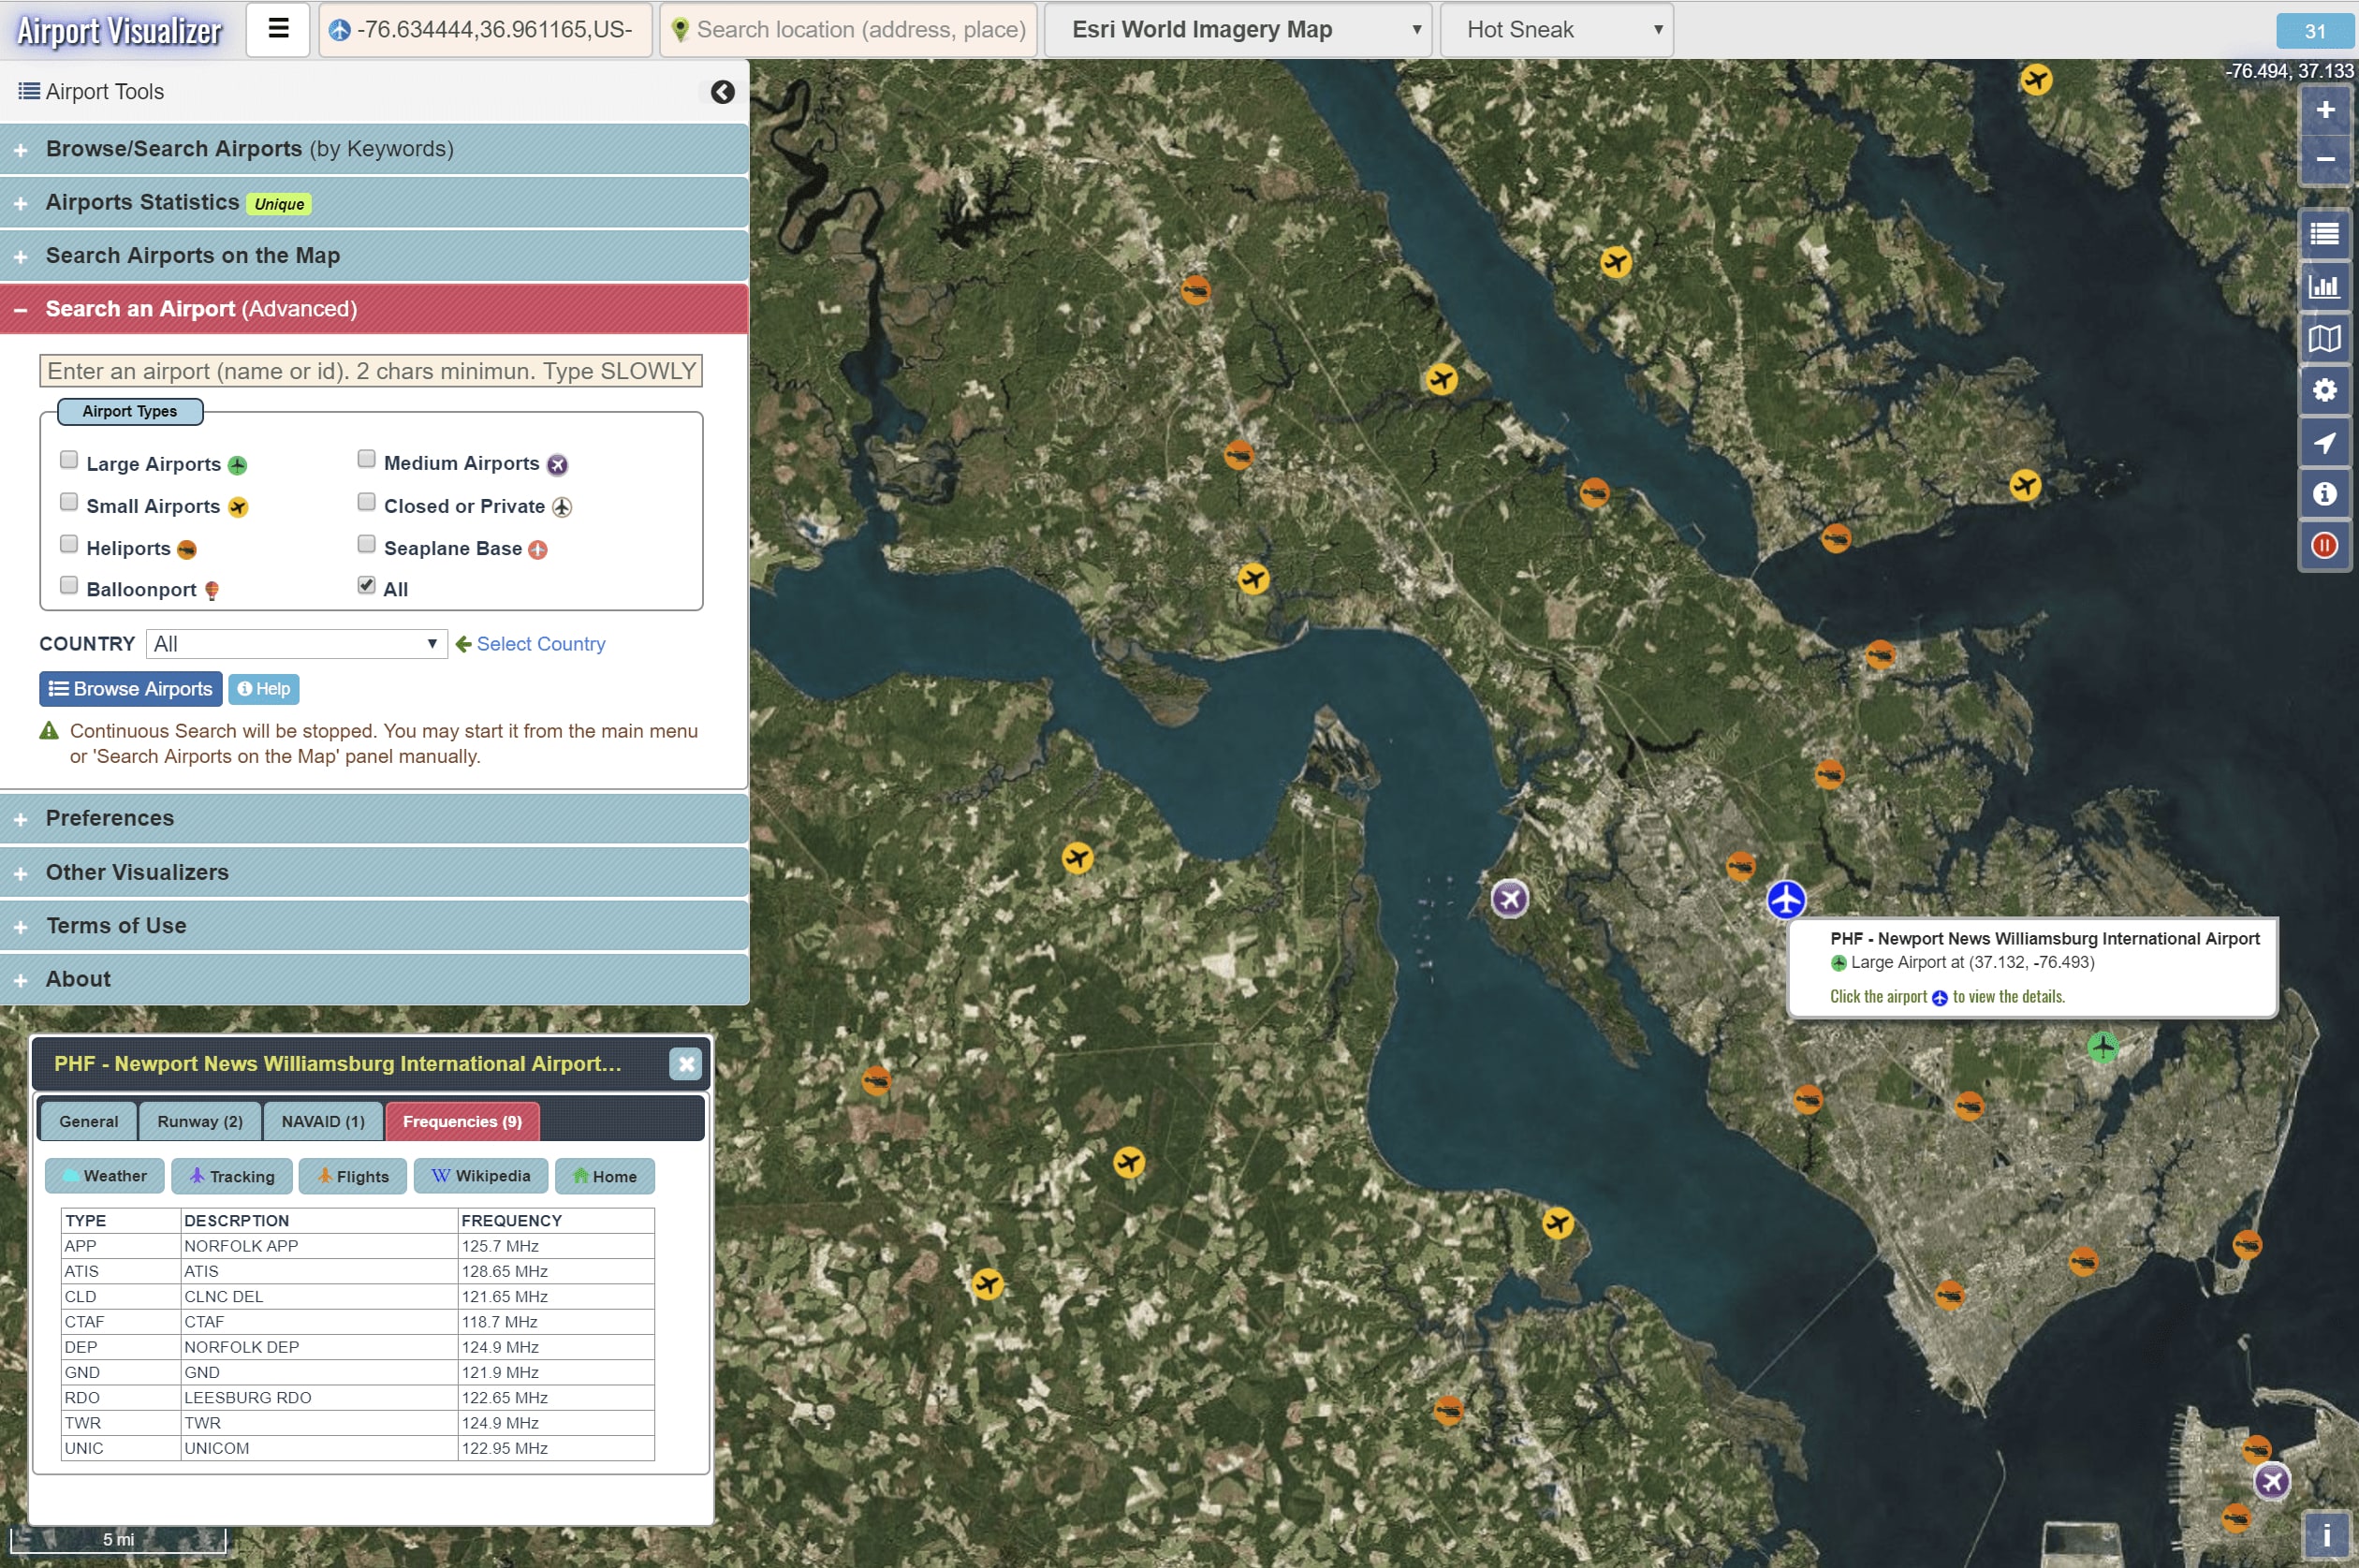
The unique feature is: it can answer intelligent questions like following for any continent, country, and region in the world:
- Which small airports in Europe have scheduled flight services? Where are they?
- How many small and medium airports in USA have at least 5 runways? Where are they?
- Which medium airports in Asia have a runway > 3500 meters in length? Where are they?
- How many airports in the world are higher than 12000 feet (AMSL)? Where are they?
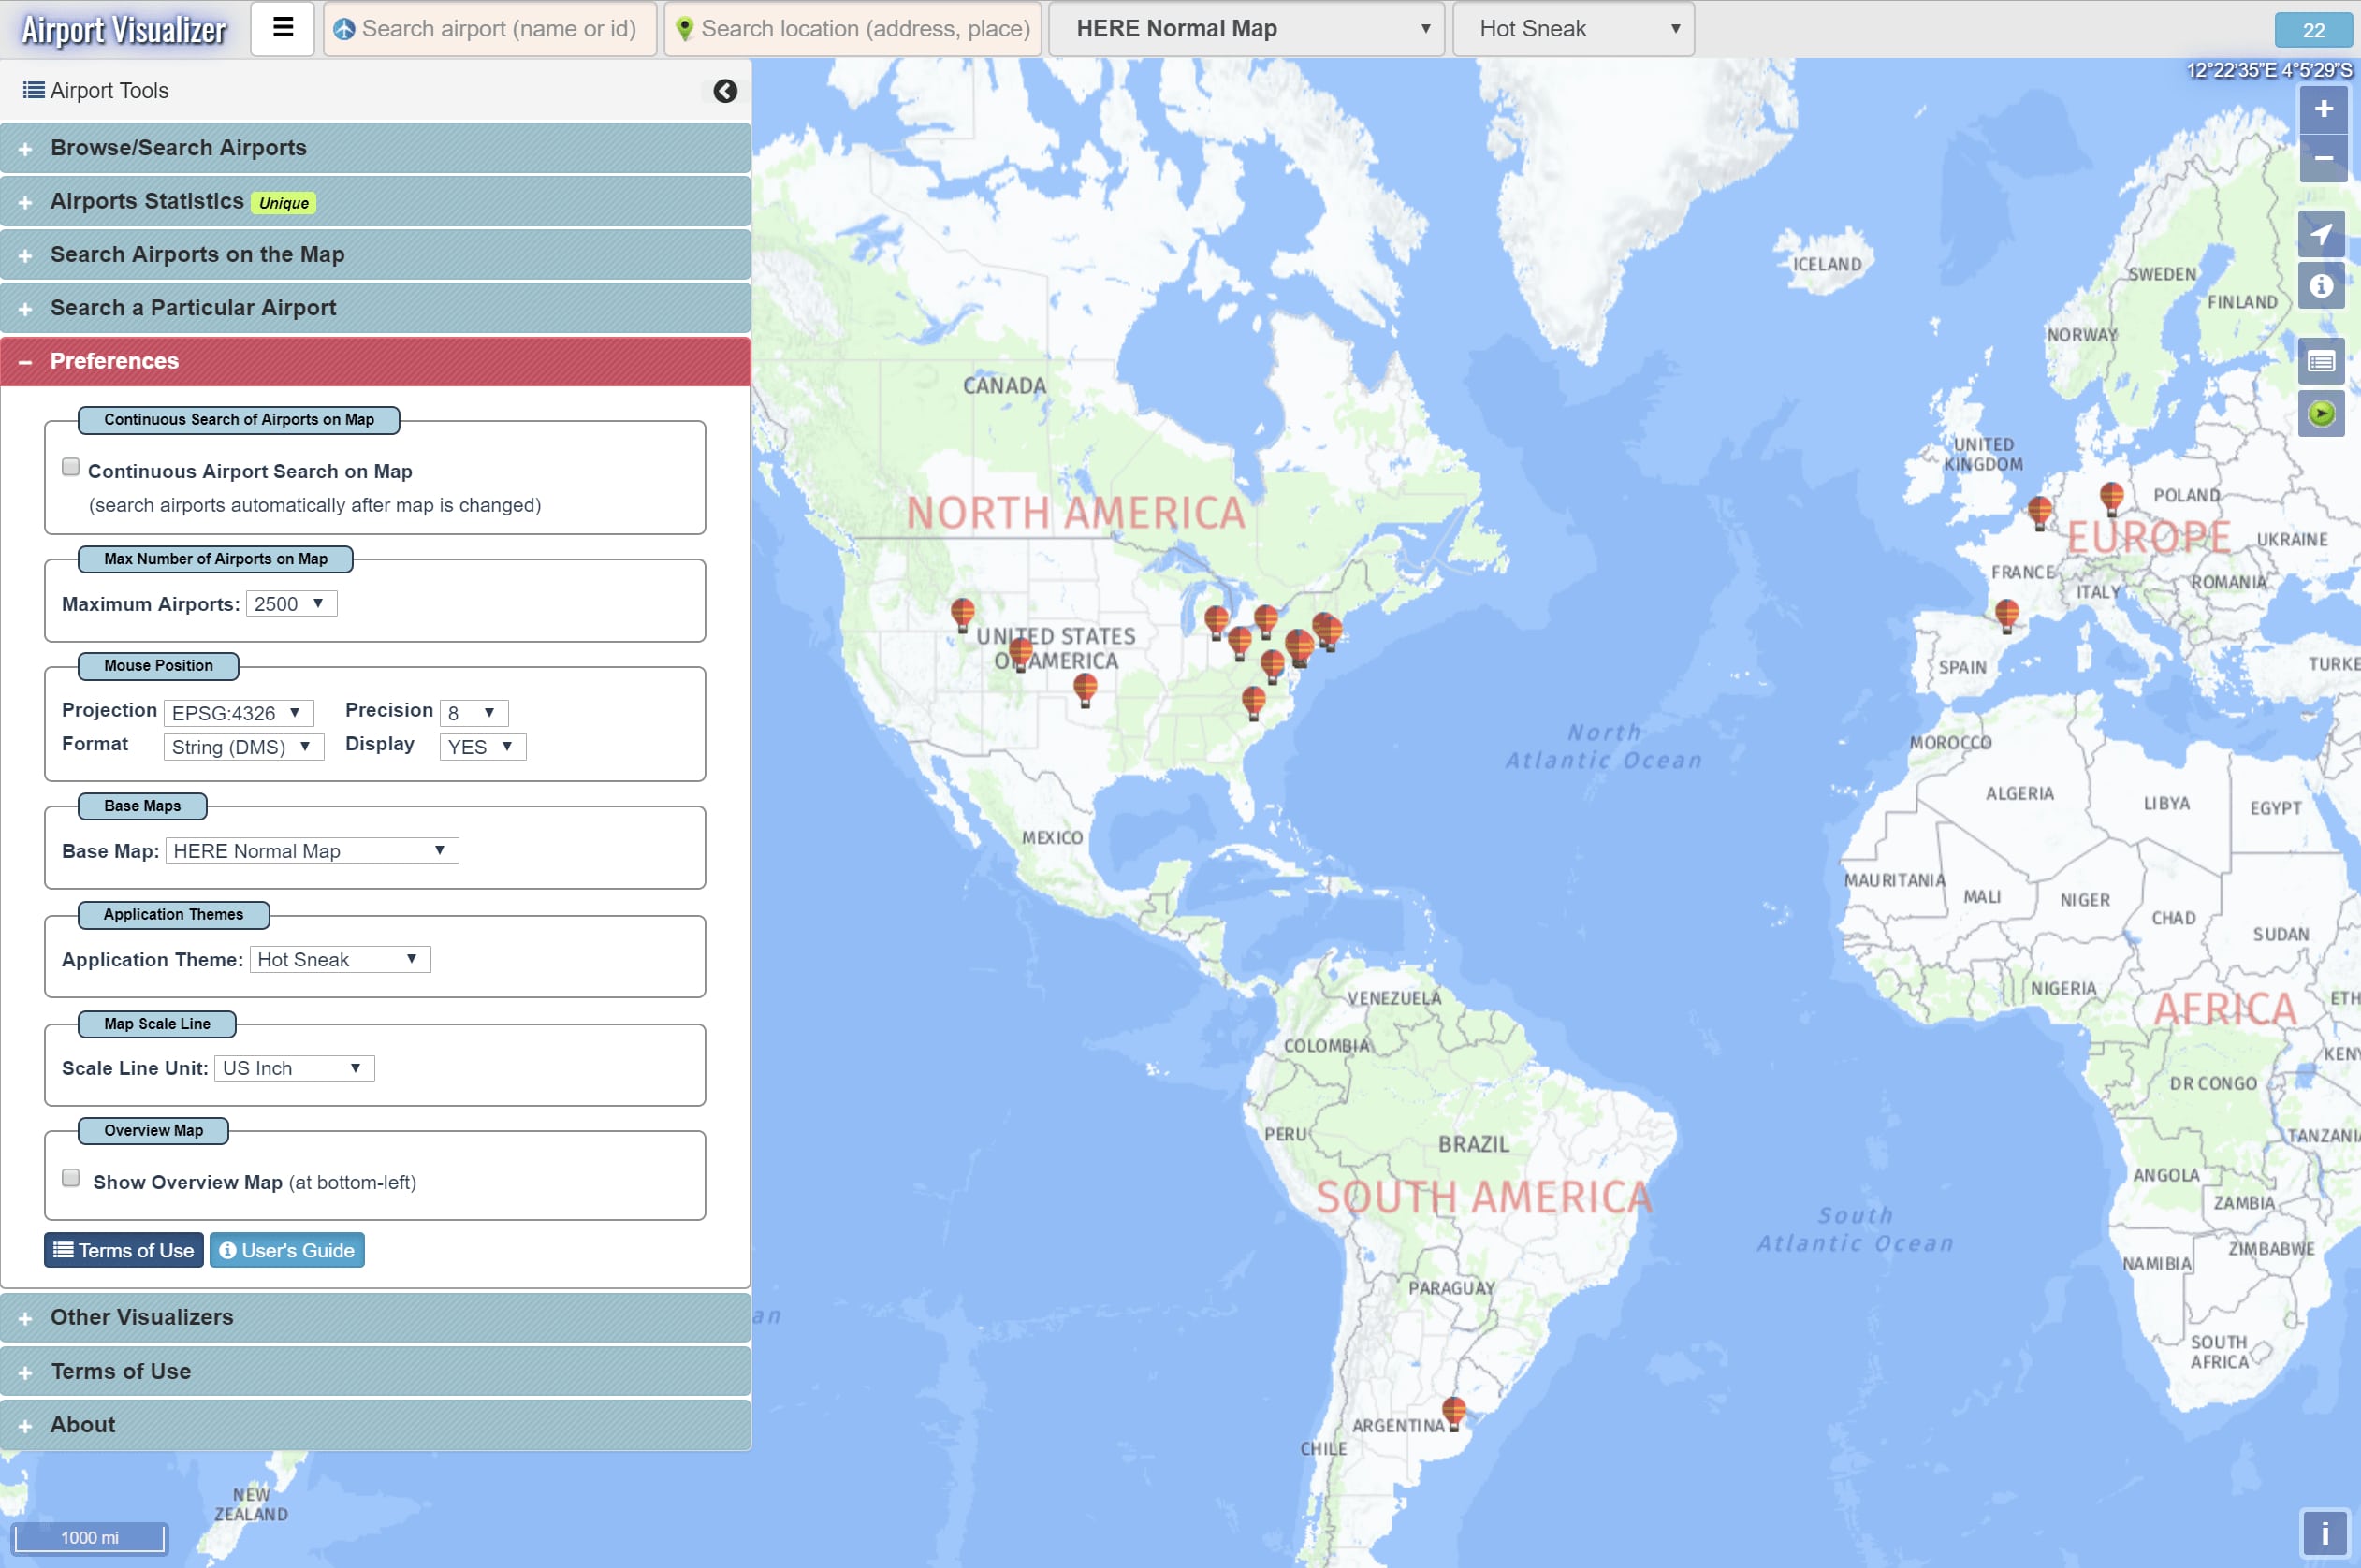
Airports in answers of above questions can be visualized on the maps of your choice.
Launch Airport Visualizer More Info Screens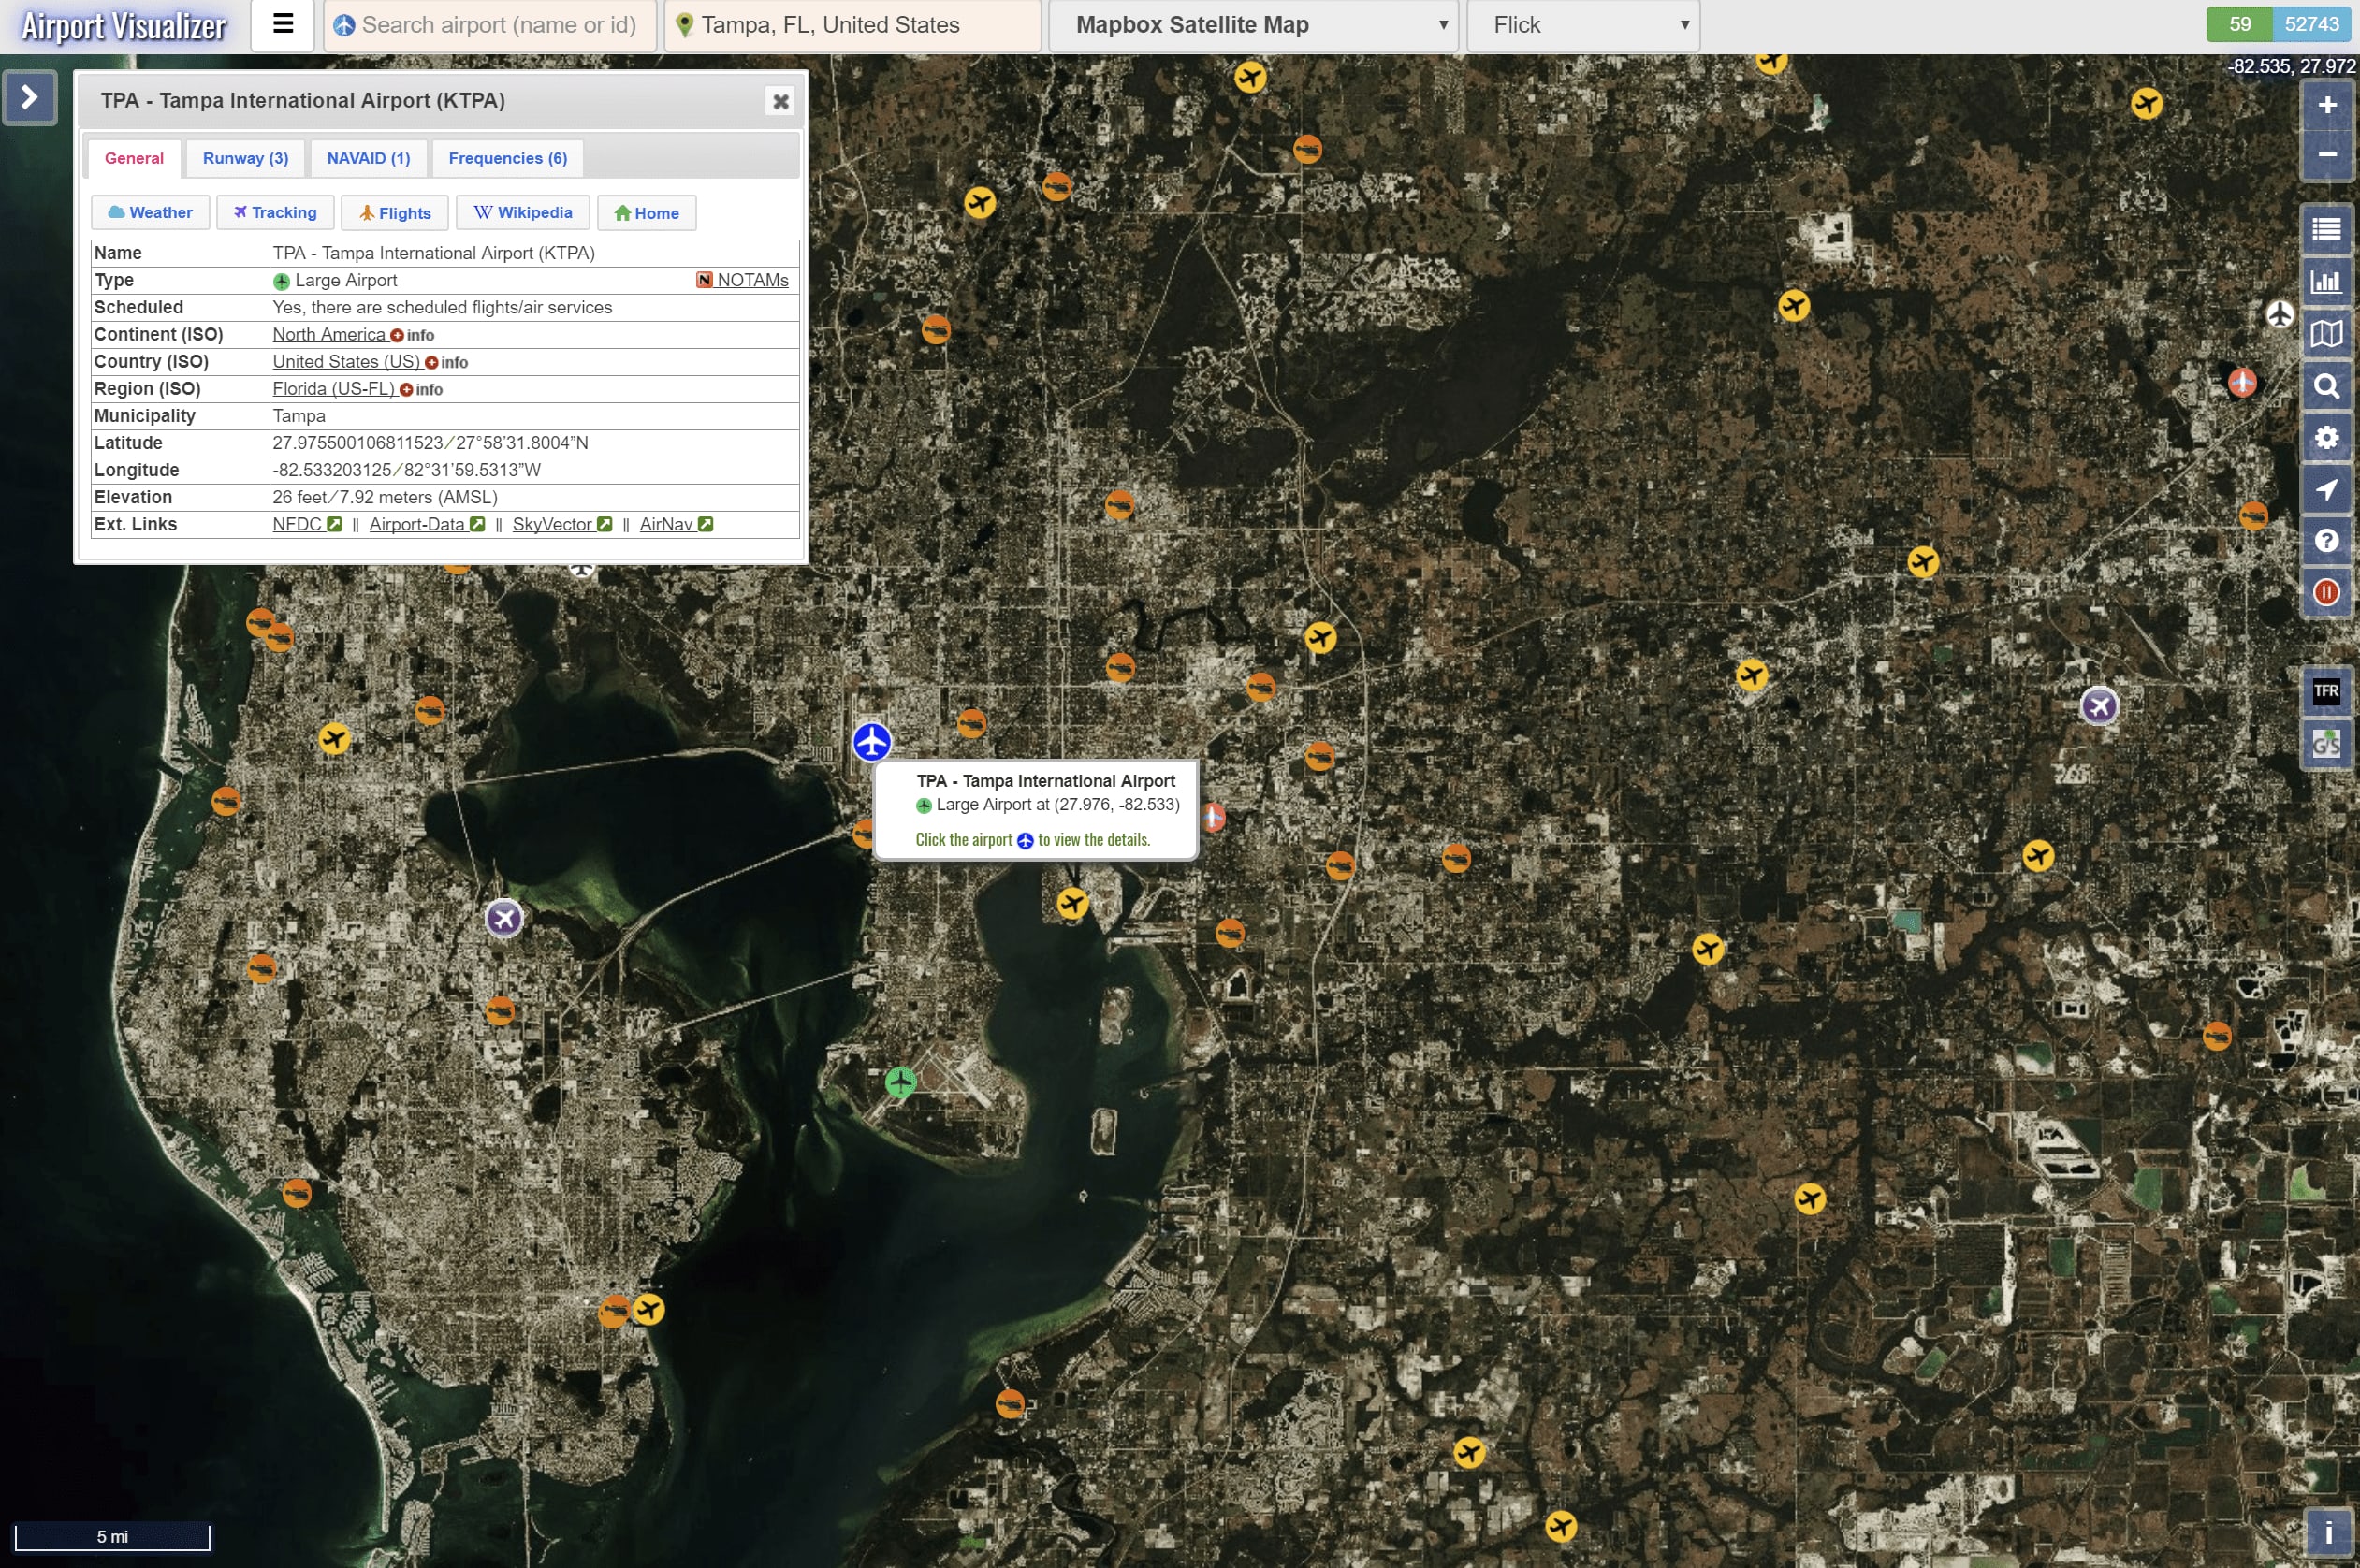
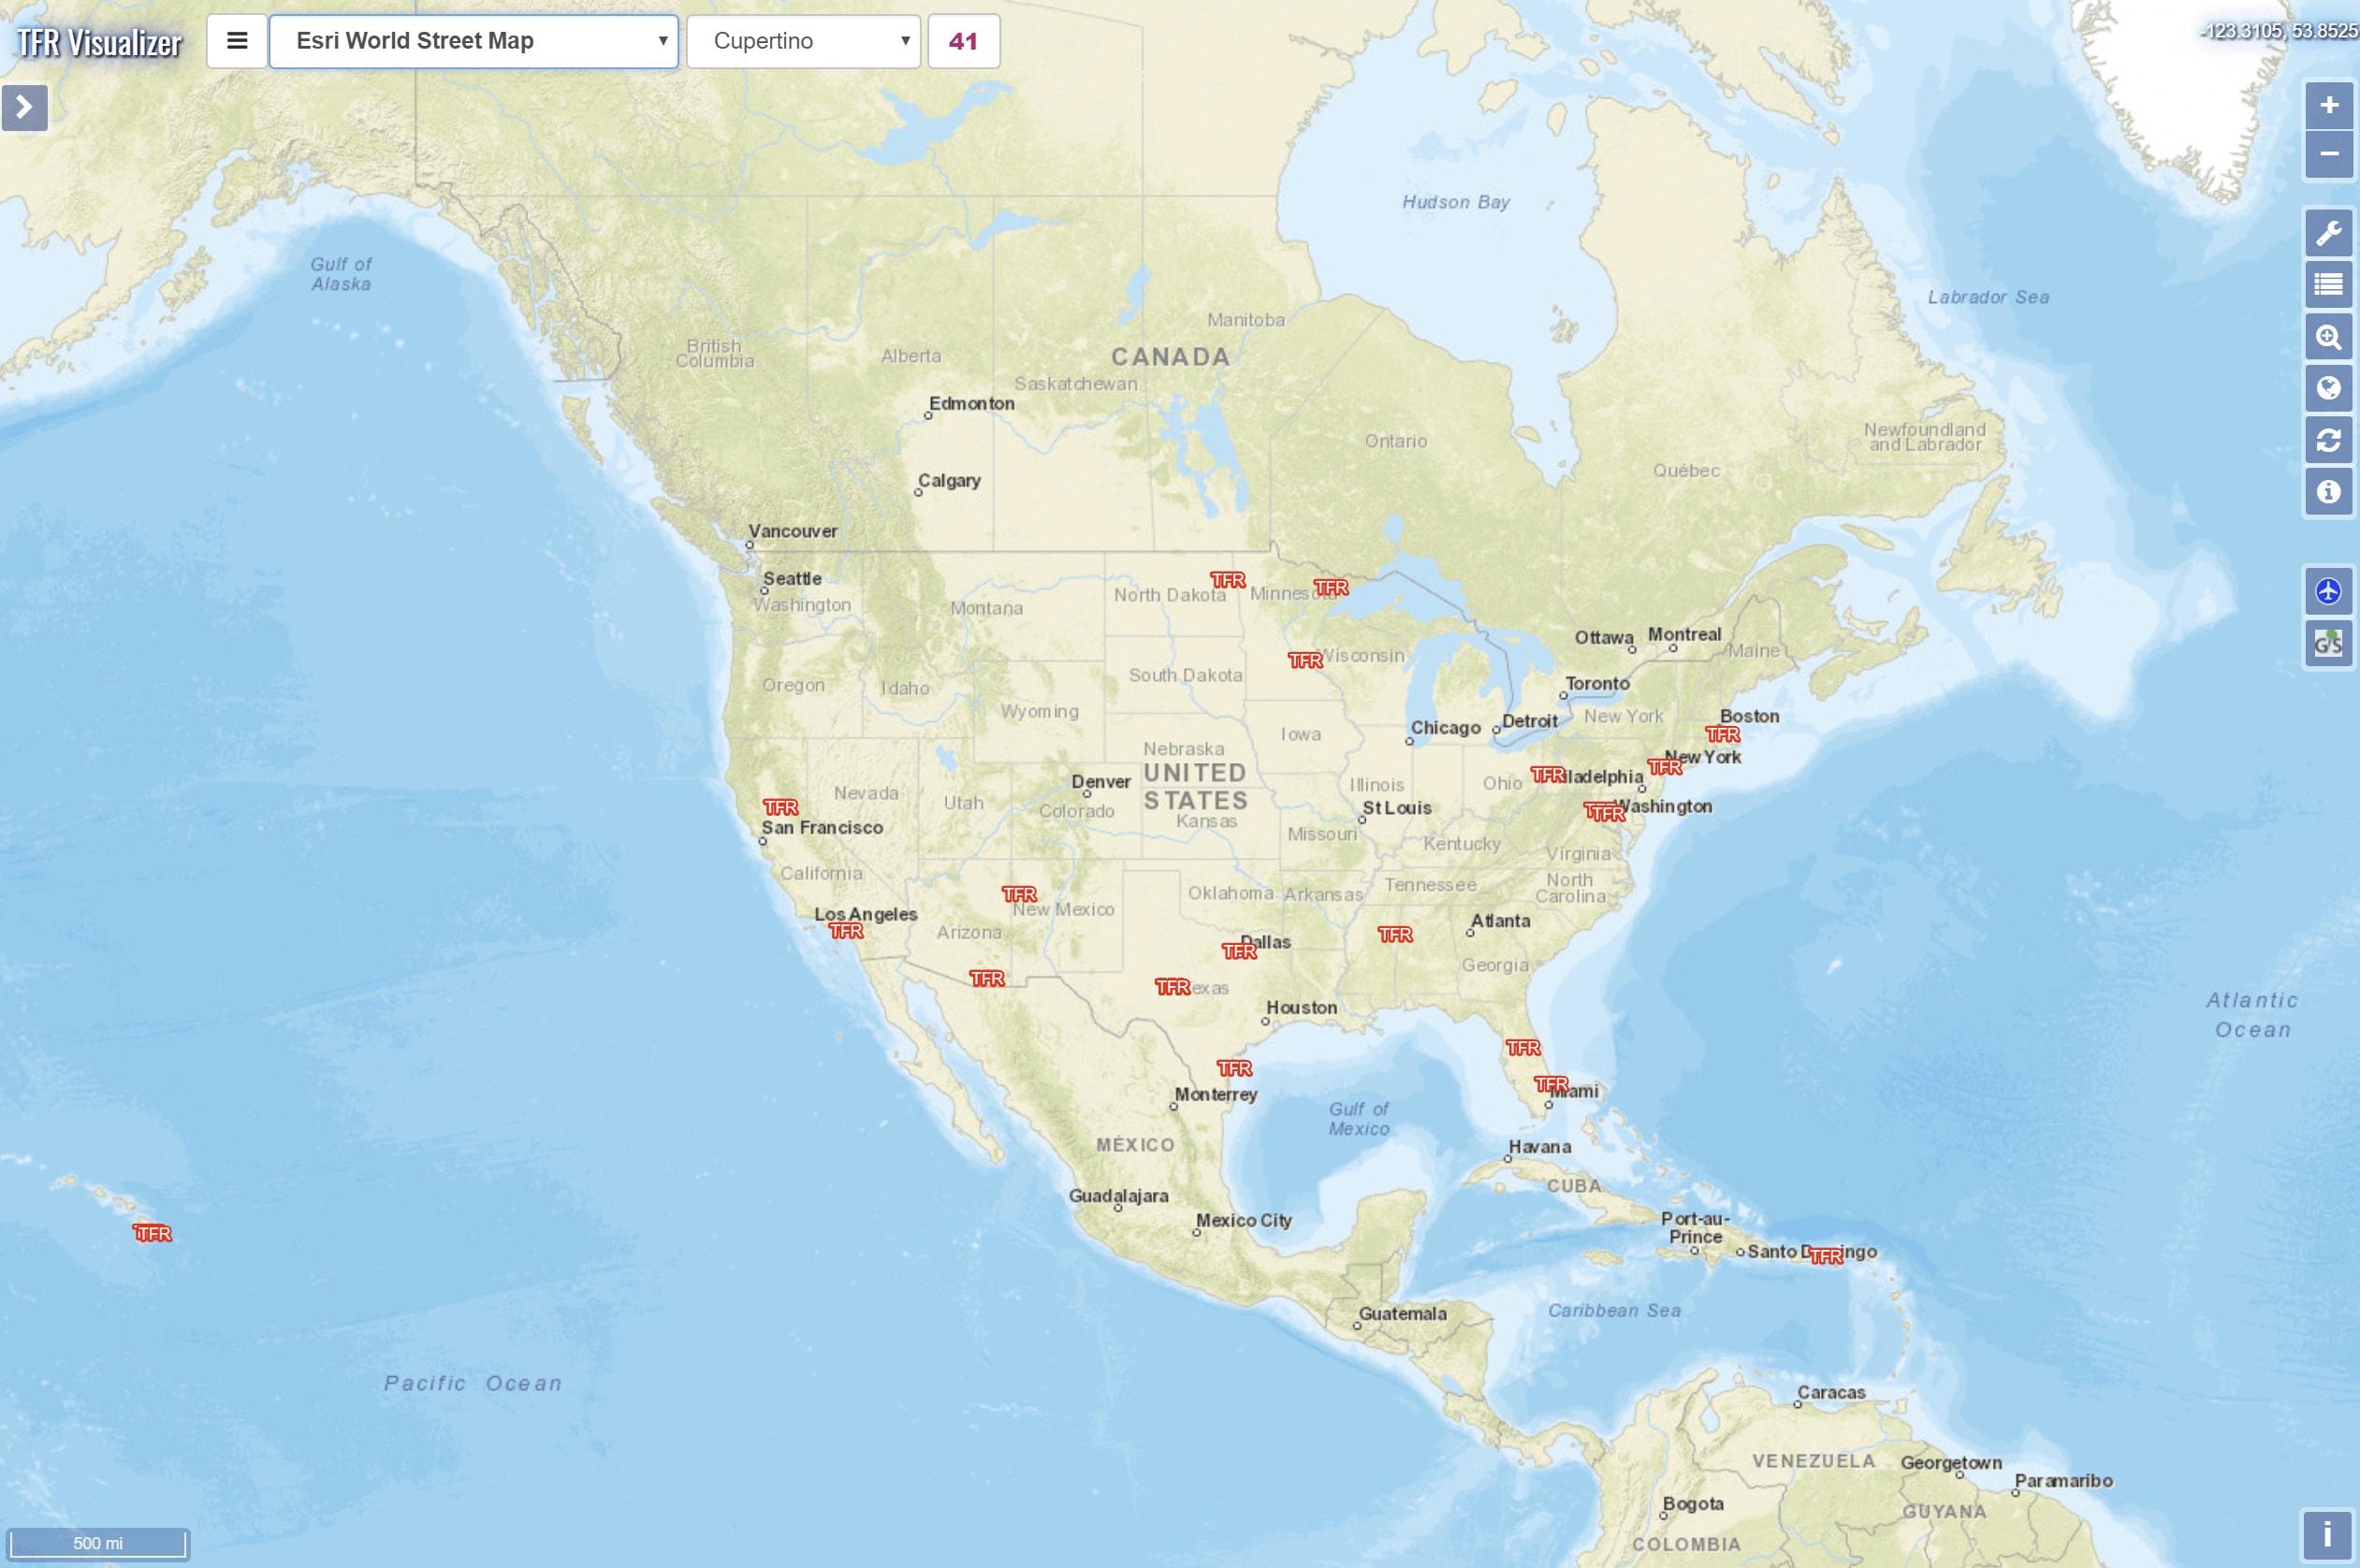
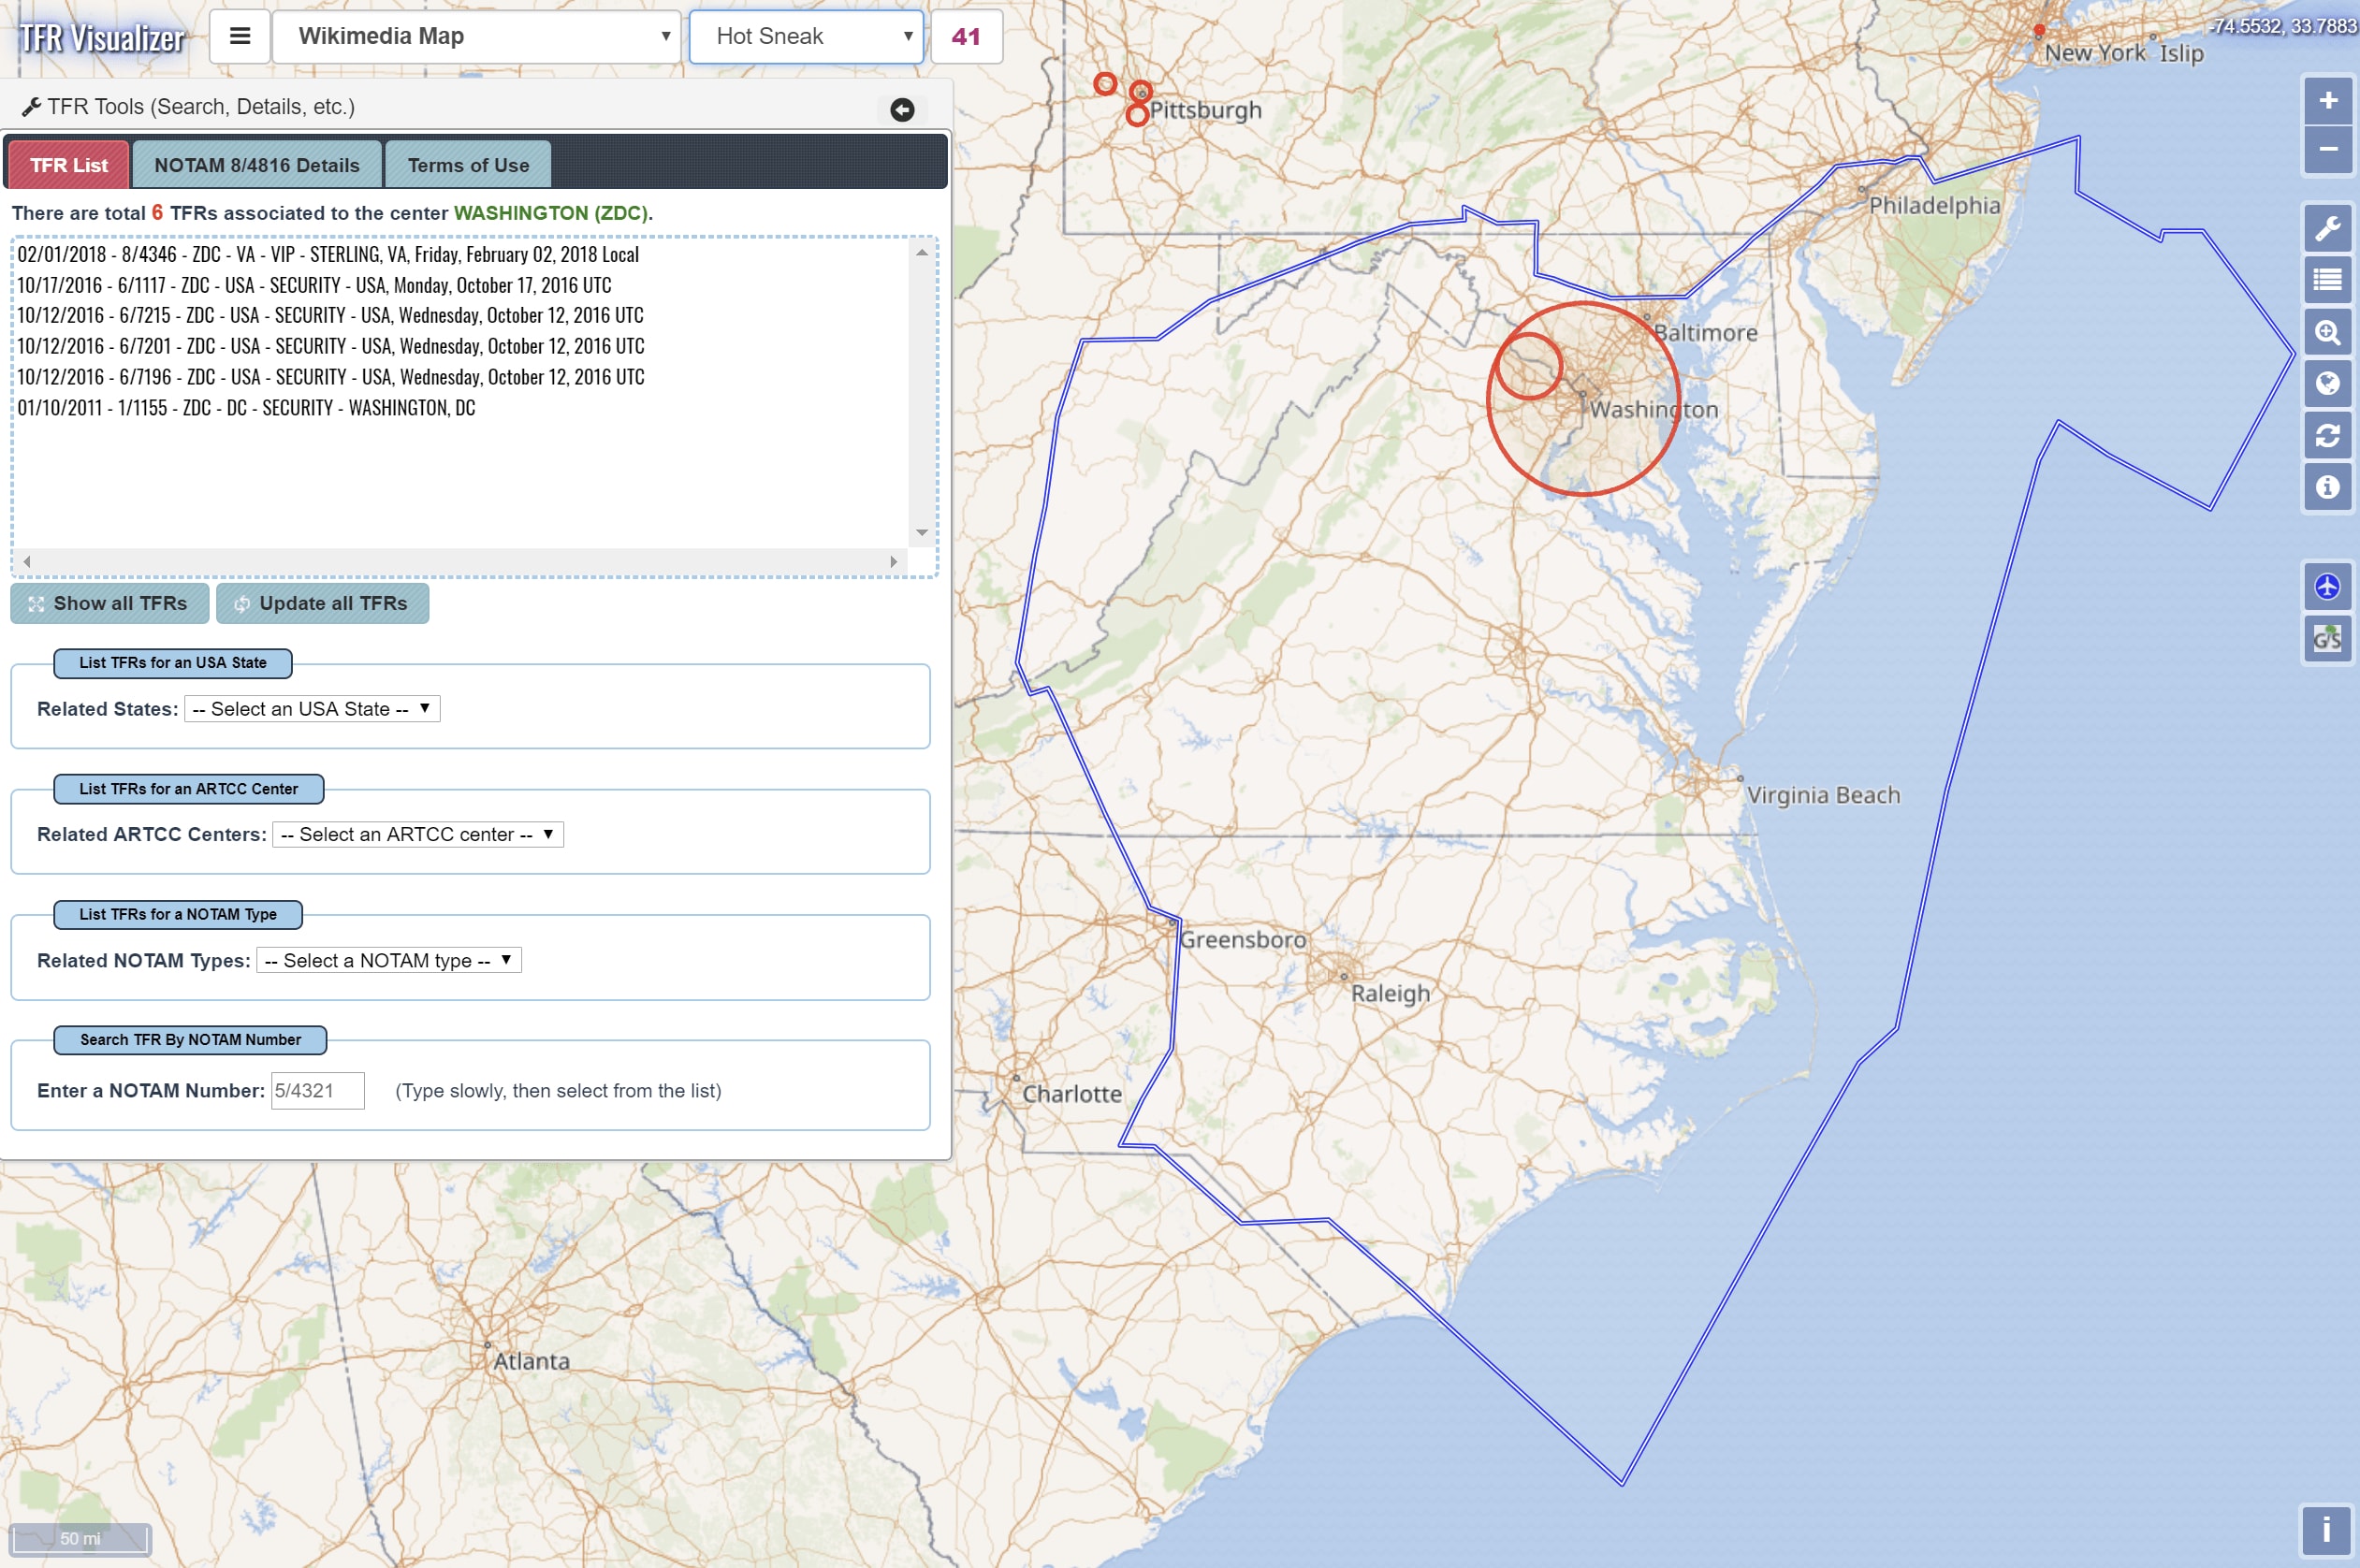
TFR Visualizer
TTFR Visualizer answers the question: "Where are Temporary Flight Restrictions?" by visualizing all the current TFRs on maps, connecting them with associated information together: Geometries, NOTAM, Shapefiles, XML, etc.
A TFR (Temporary Flight Restriction) is a geographically-limited, short-term, airspace restriction, typically in the United States.
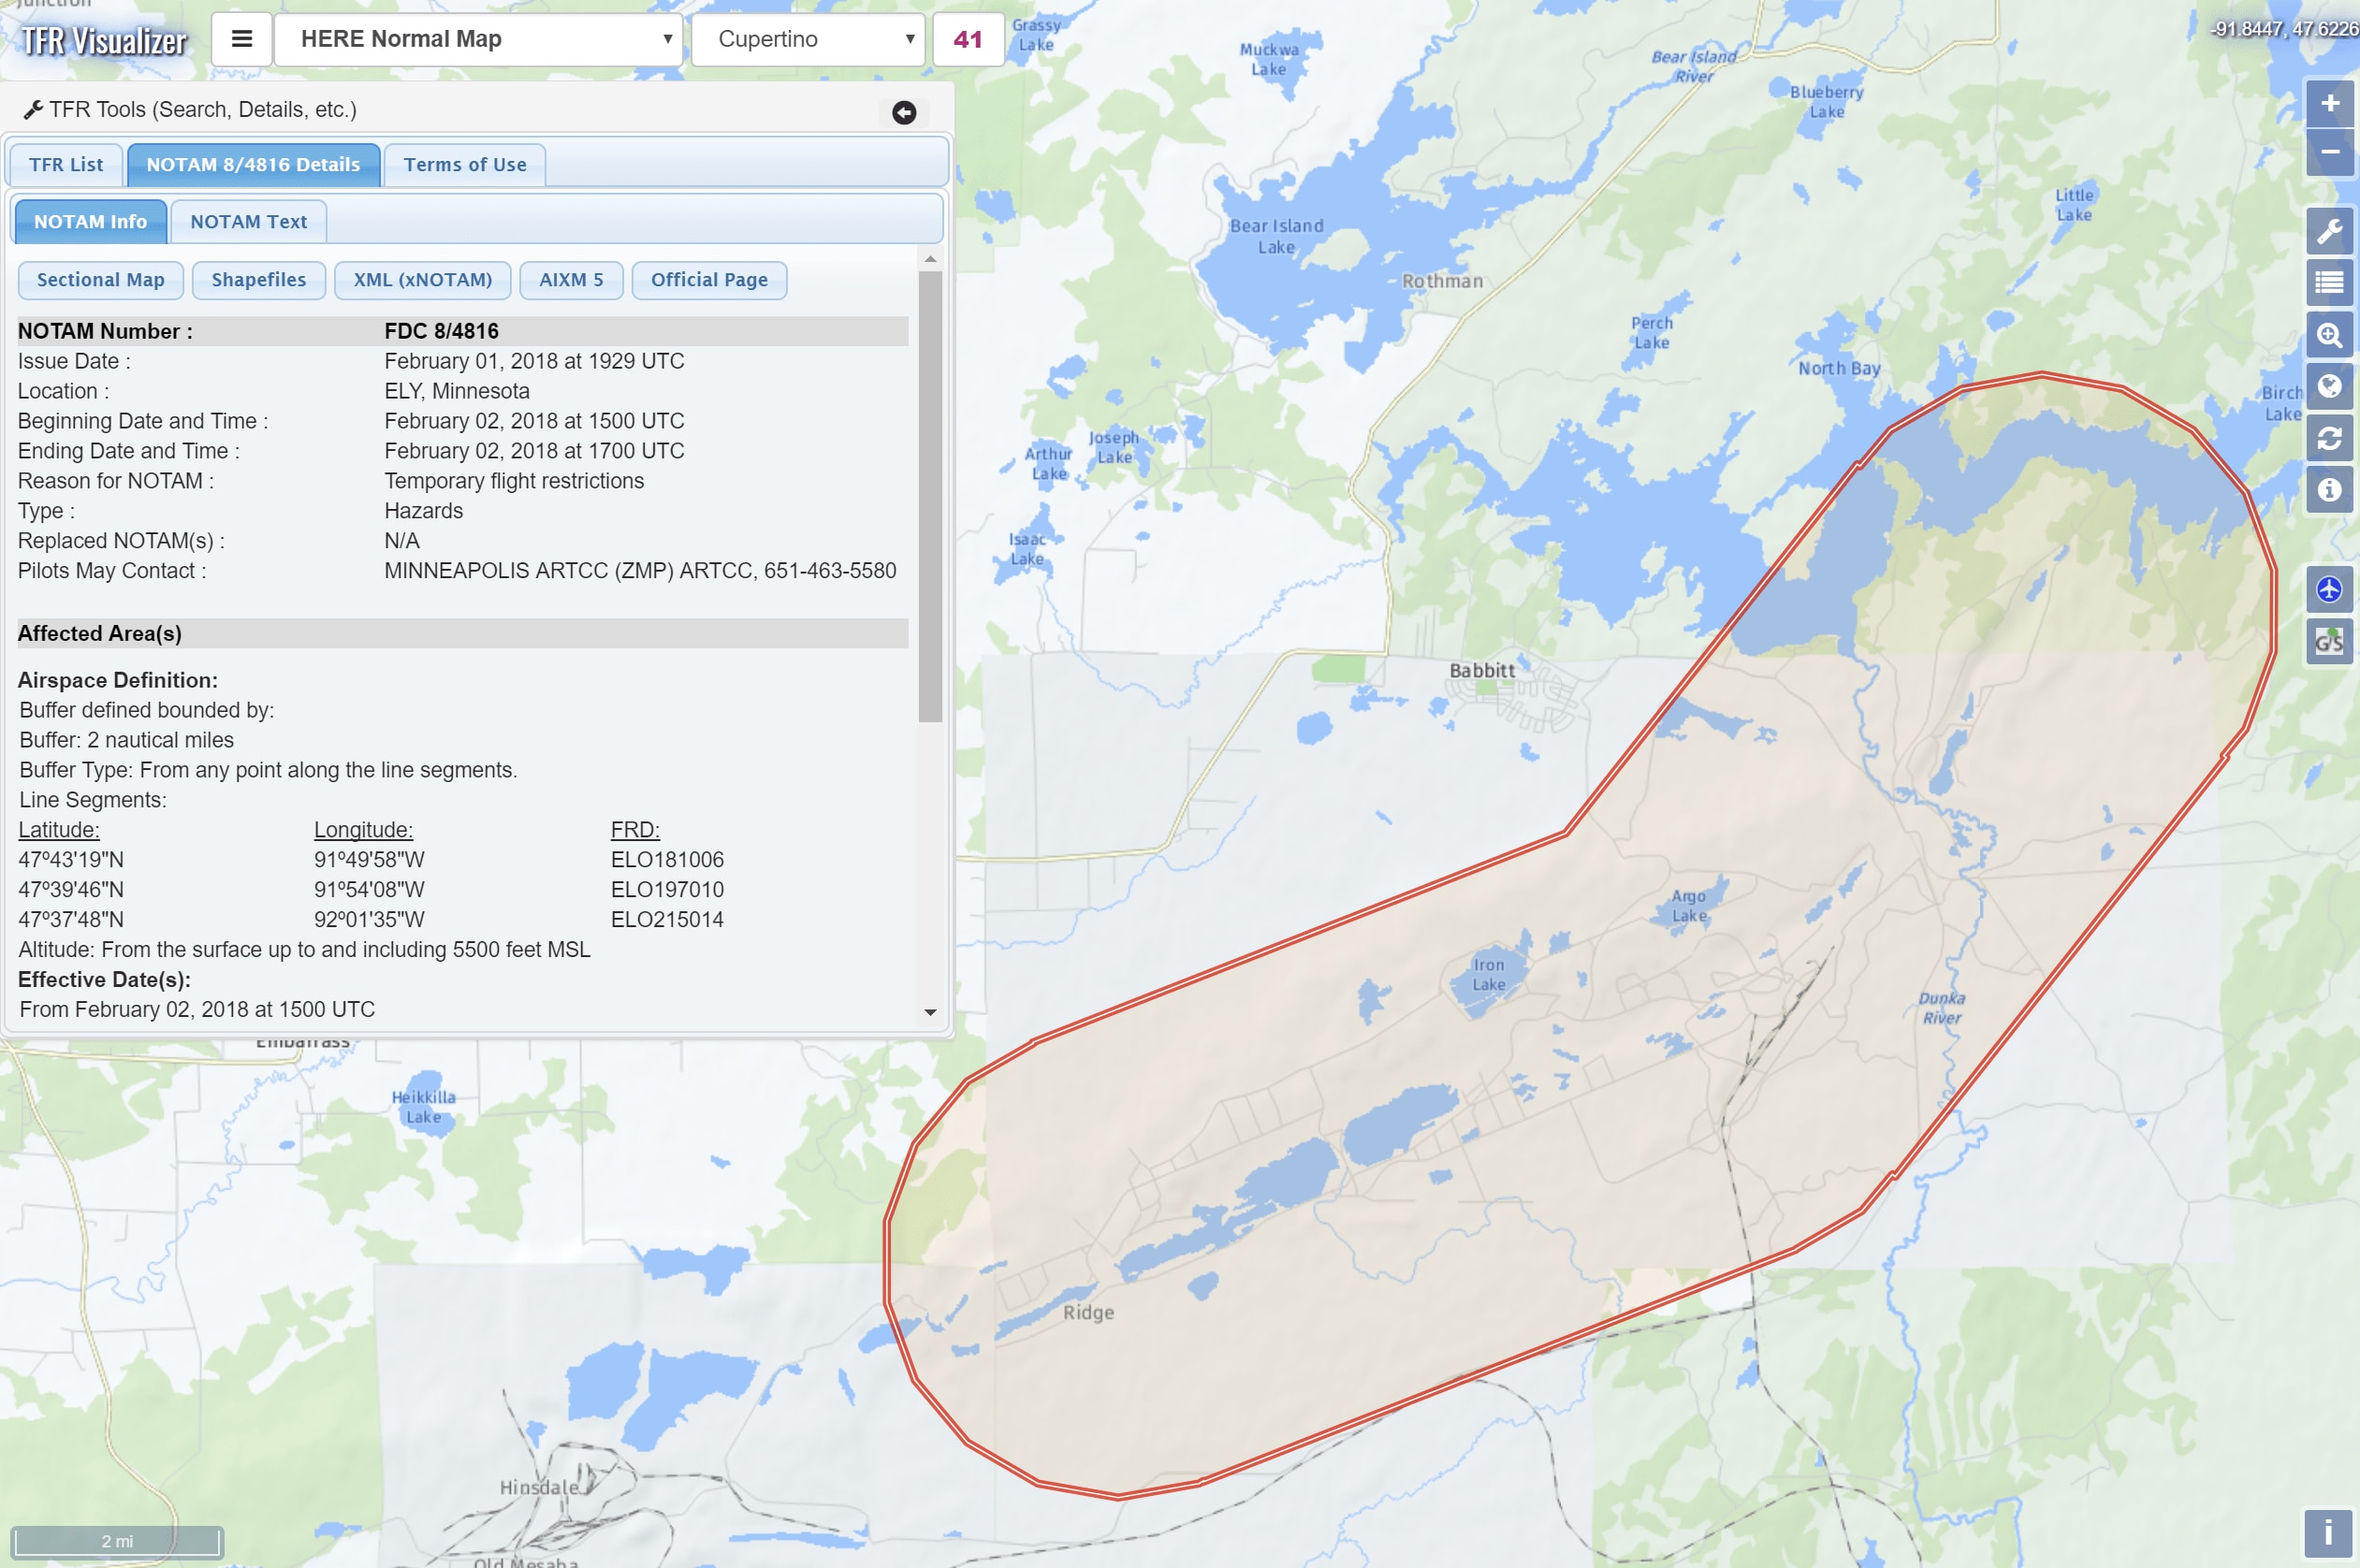
- Explore the TFR geometries in detail on 30+ base maps.
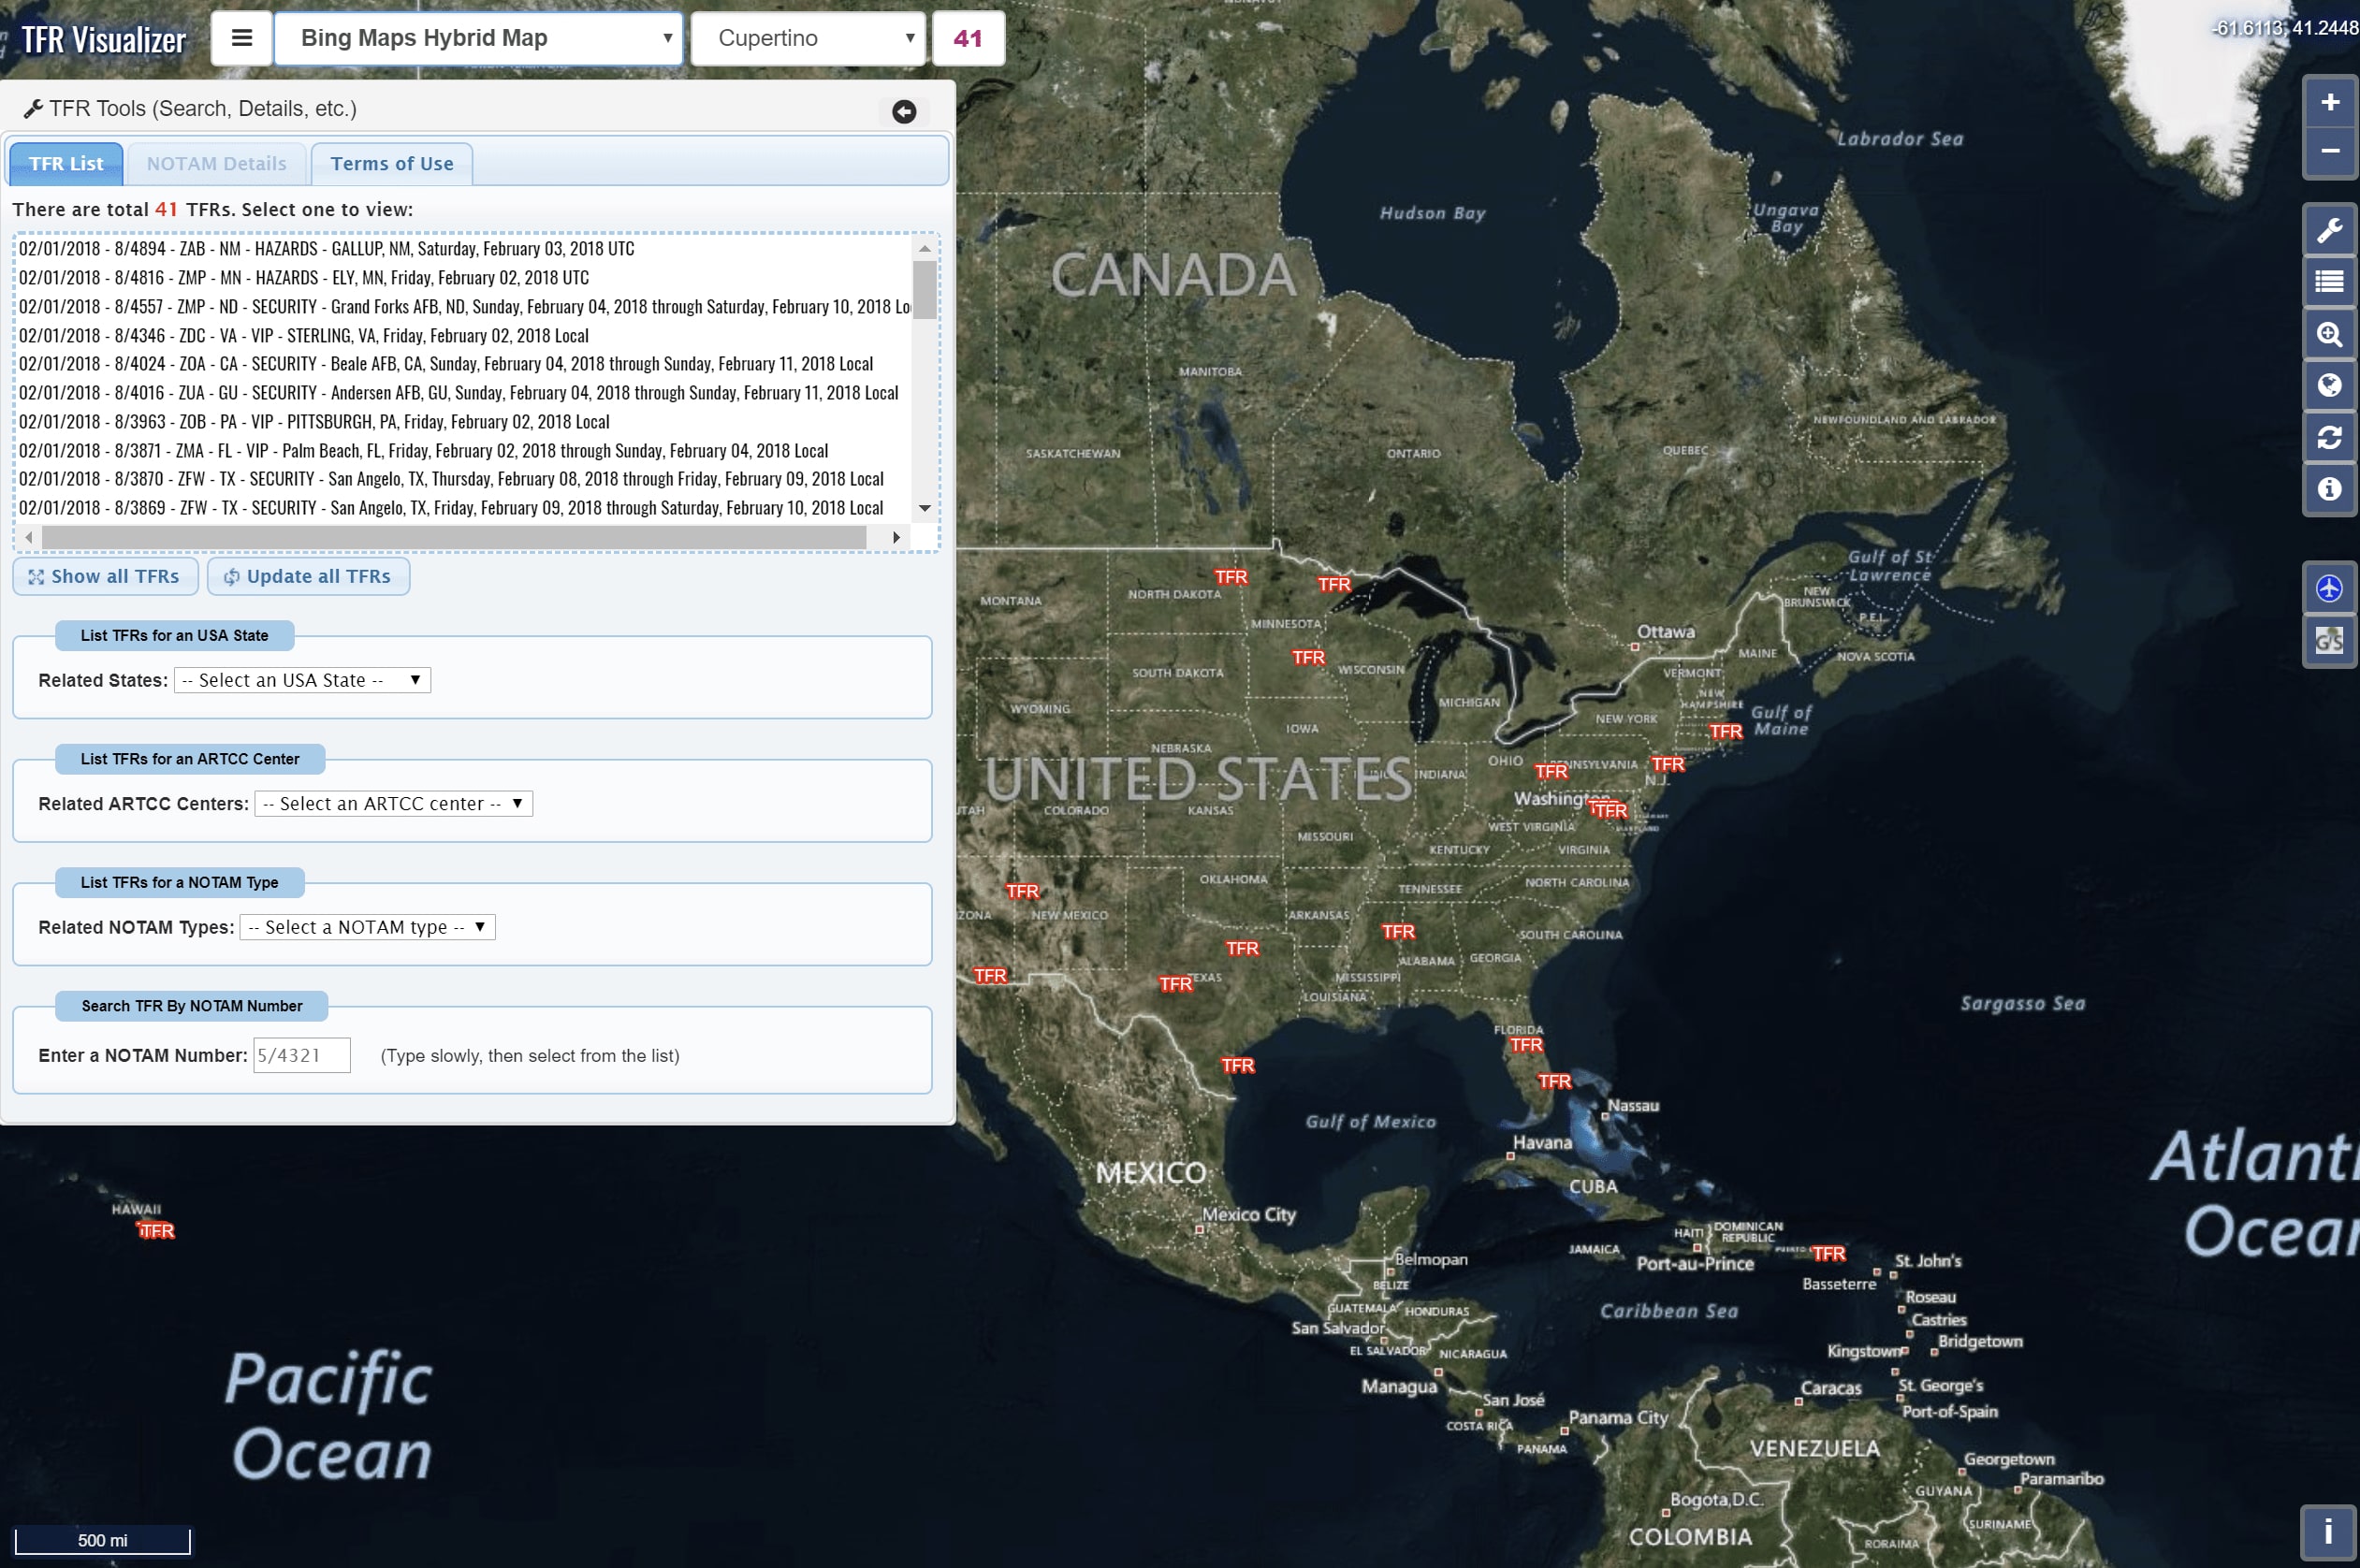
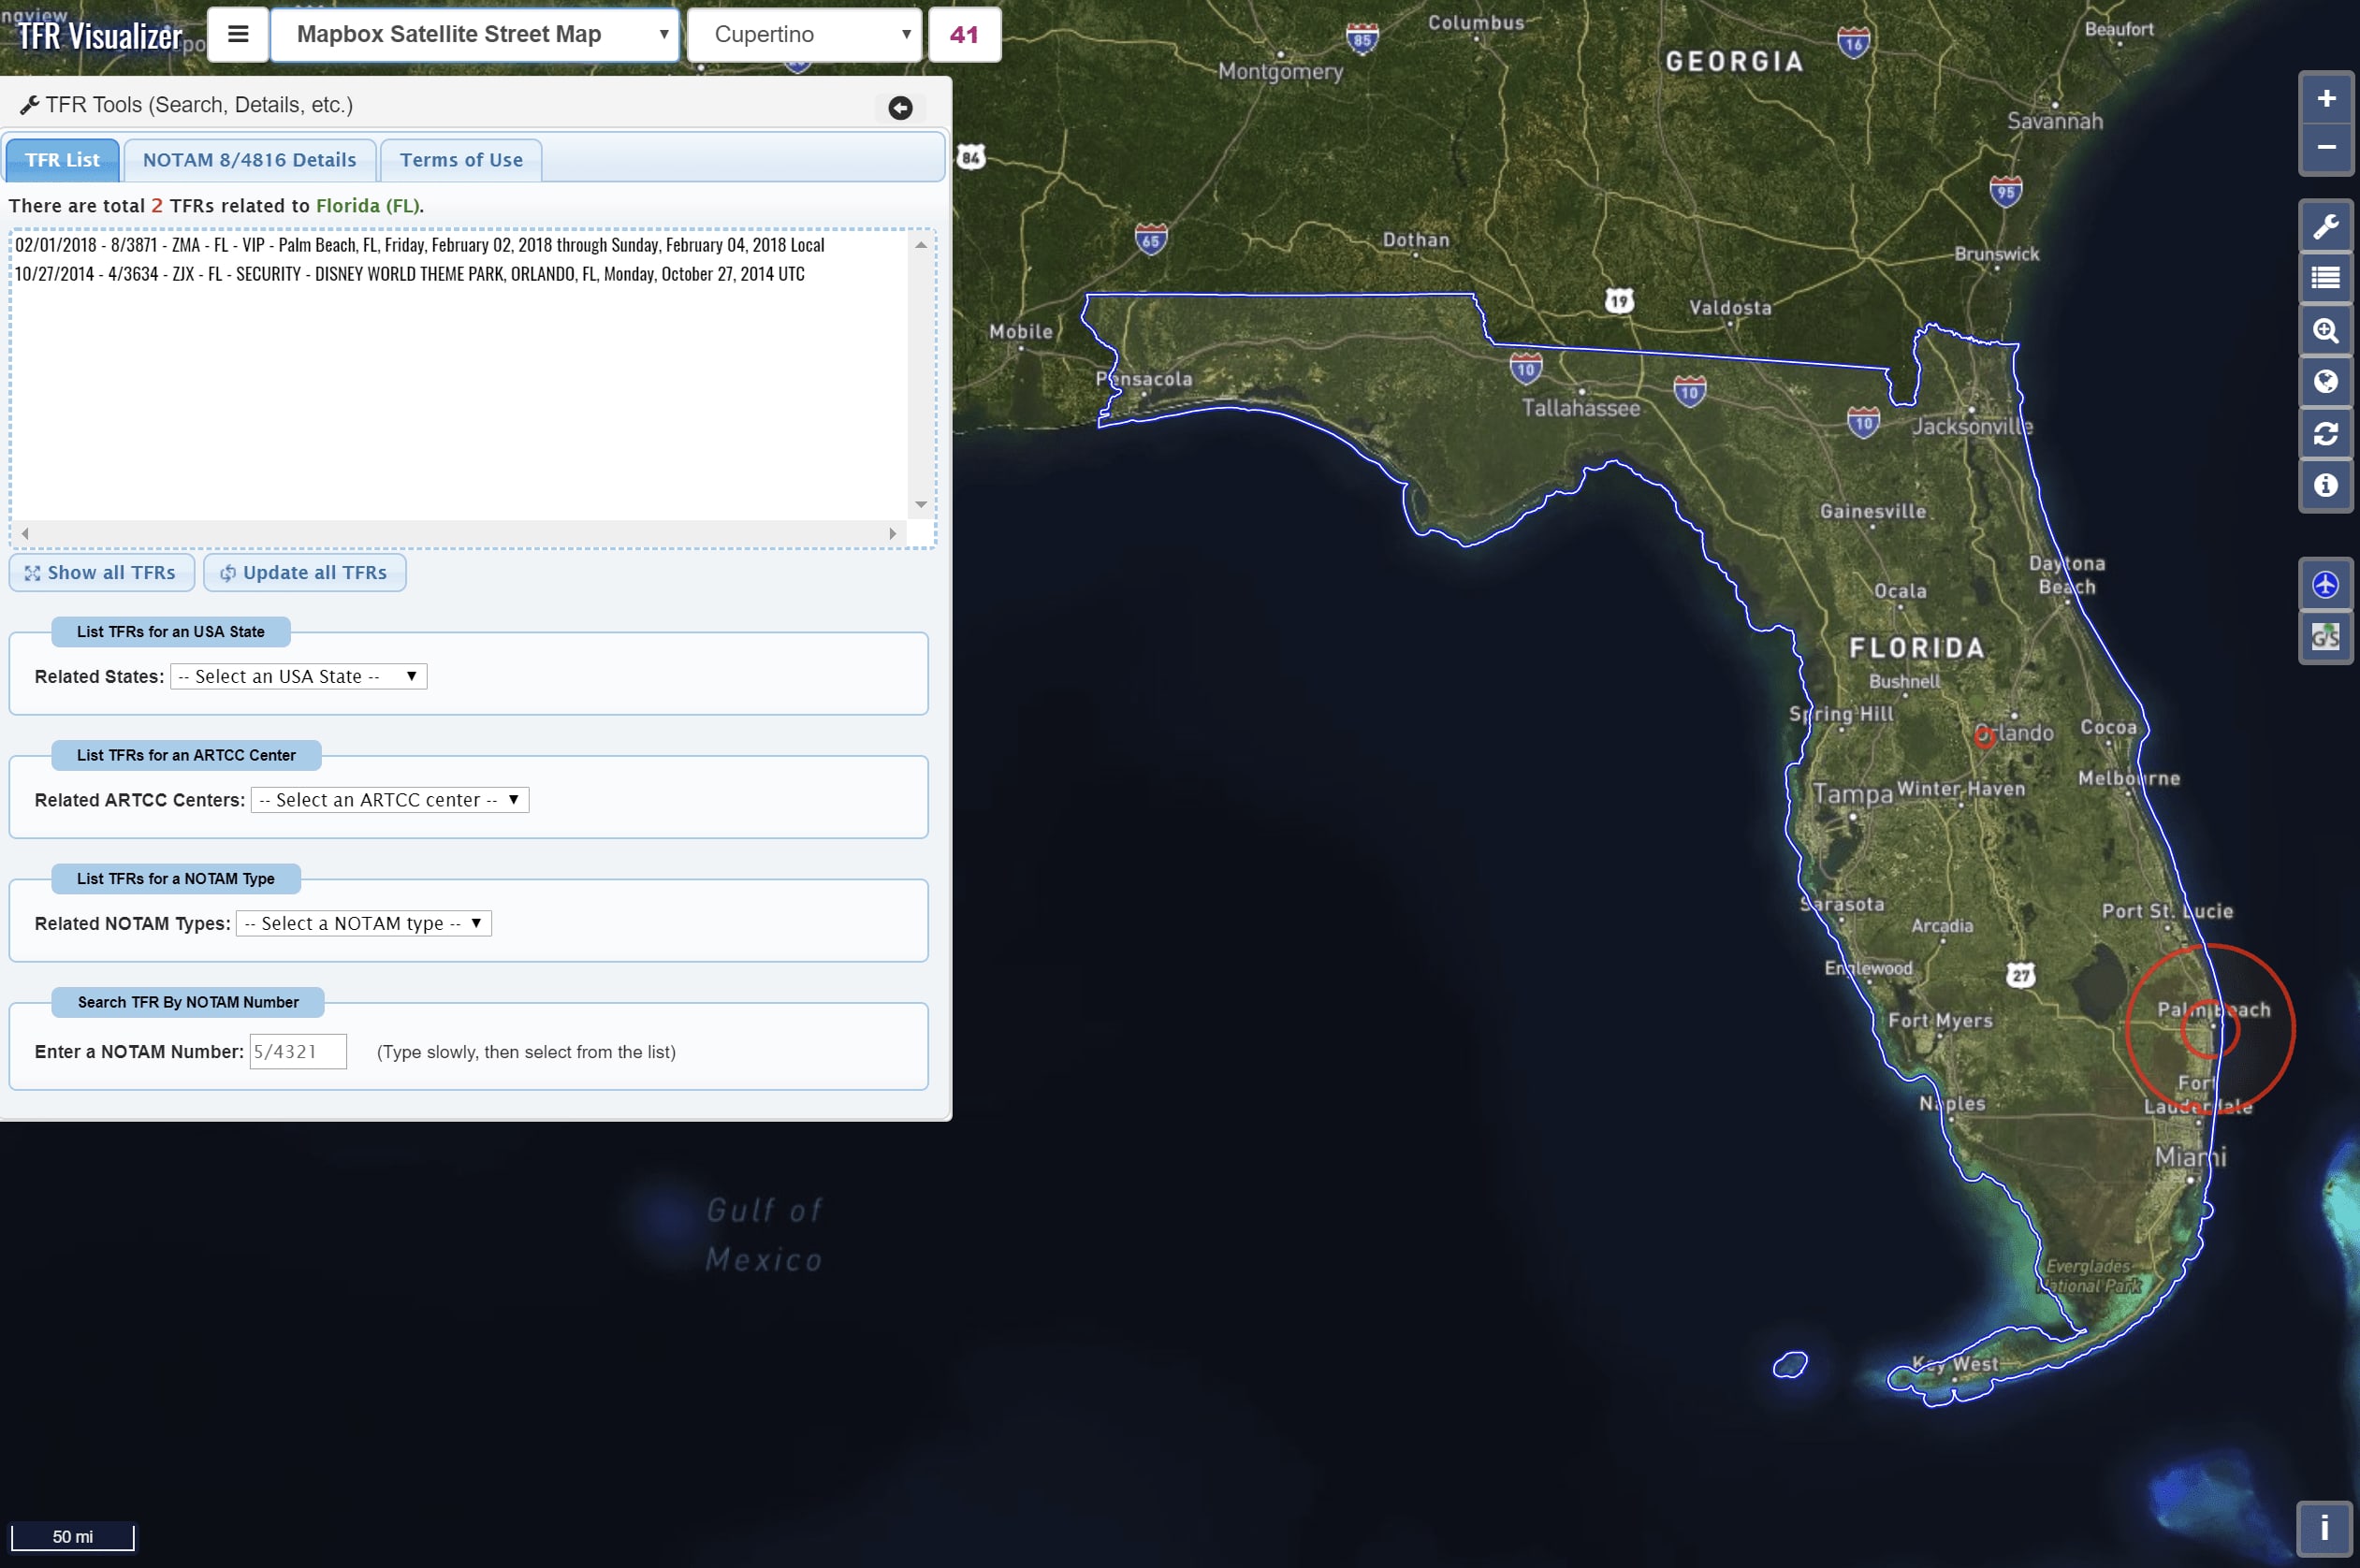
- Search TFRs by state, ARTCC center, type, and NOTAM number.
- Visualize all TFRs in a state or ARTCC center on maps with boundaries.
- View asscociated sectional map, NOTAM, AIXM, and download shapefile.
DB Cruiser
DDB Cruiser is a leading web-based database tool with reporting and bulk data loading functionality.
It provides simple, but, very secure access to all SQL databases, through any of the major Web browsers, in order to execute SQL; to view and manipulate data, including CLOB/TEXT and BLOB/Binary; to generate reports; and, to load bulk data into tables.
The unique query-oriented approach allows you to build SQL queries at almost any place. Specially, you can start build a query visually as soon as you view the table column definitions - no SQL to write [screen]. Furthermore, for each result set, you can view the SQL which produced the result, then modify and re-execute it right at the spot!
Launch DB Cruiser More Info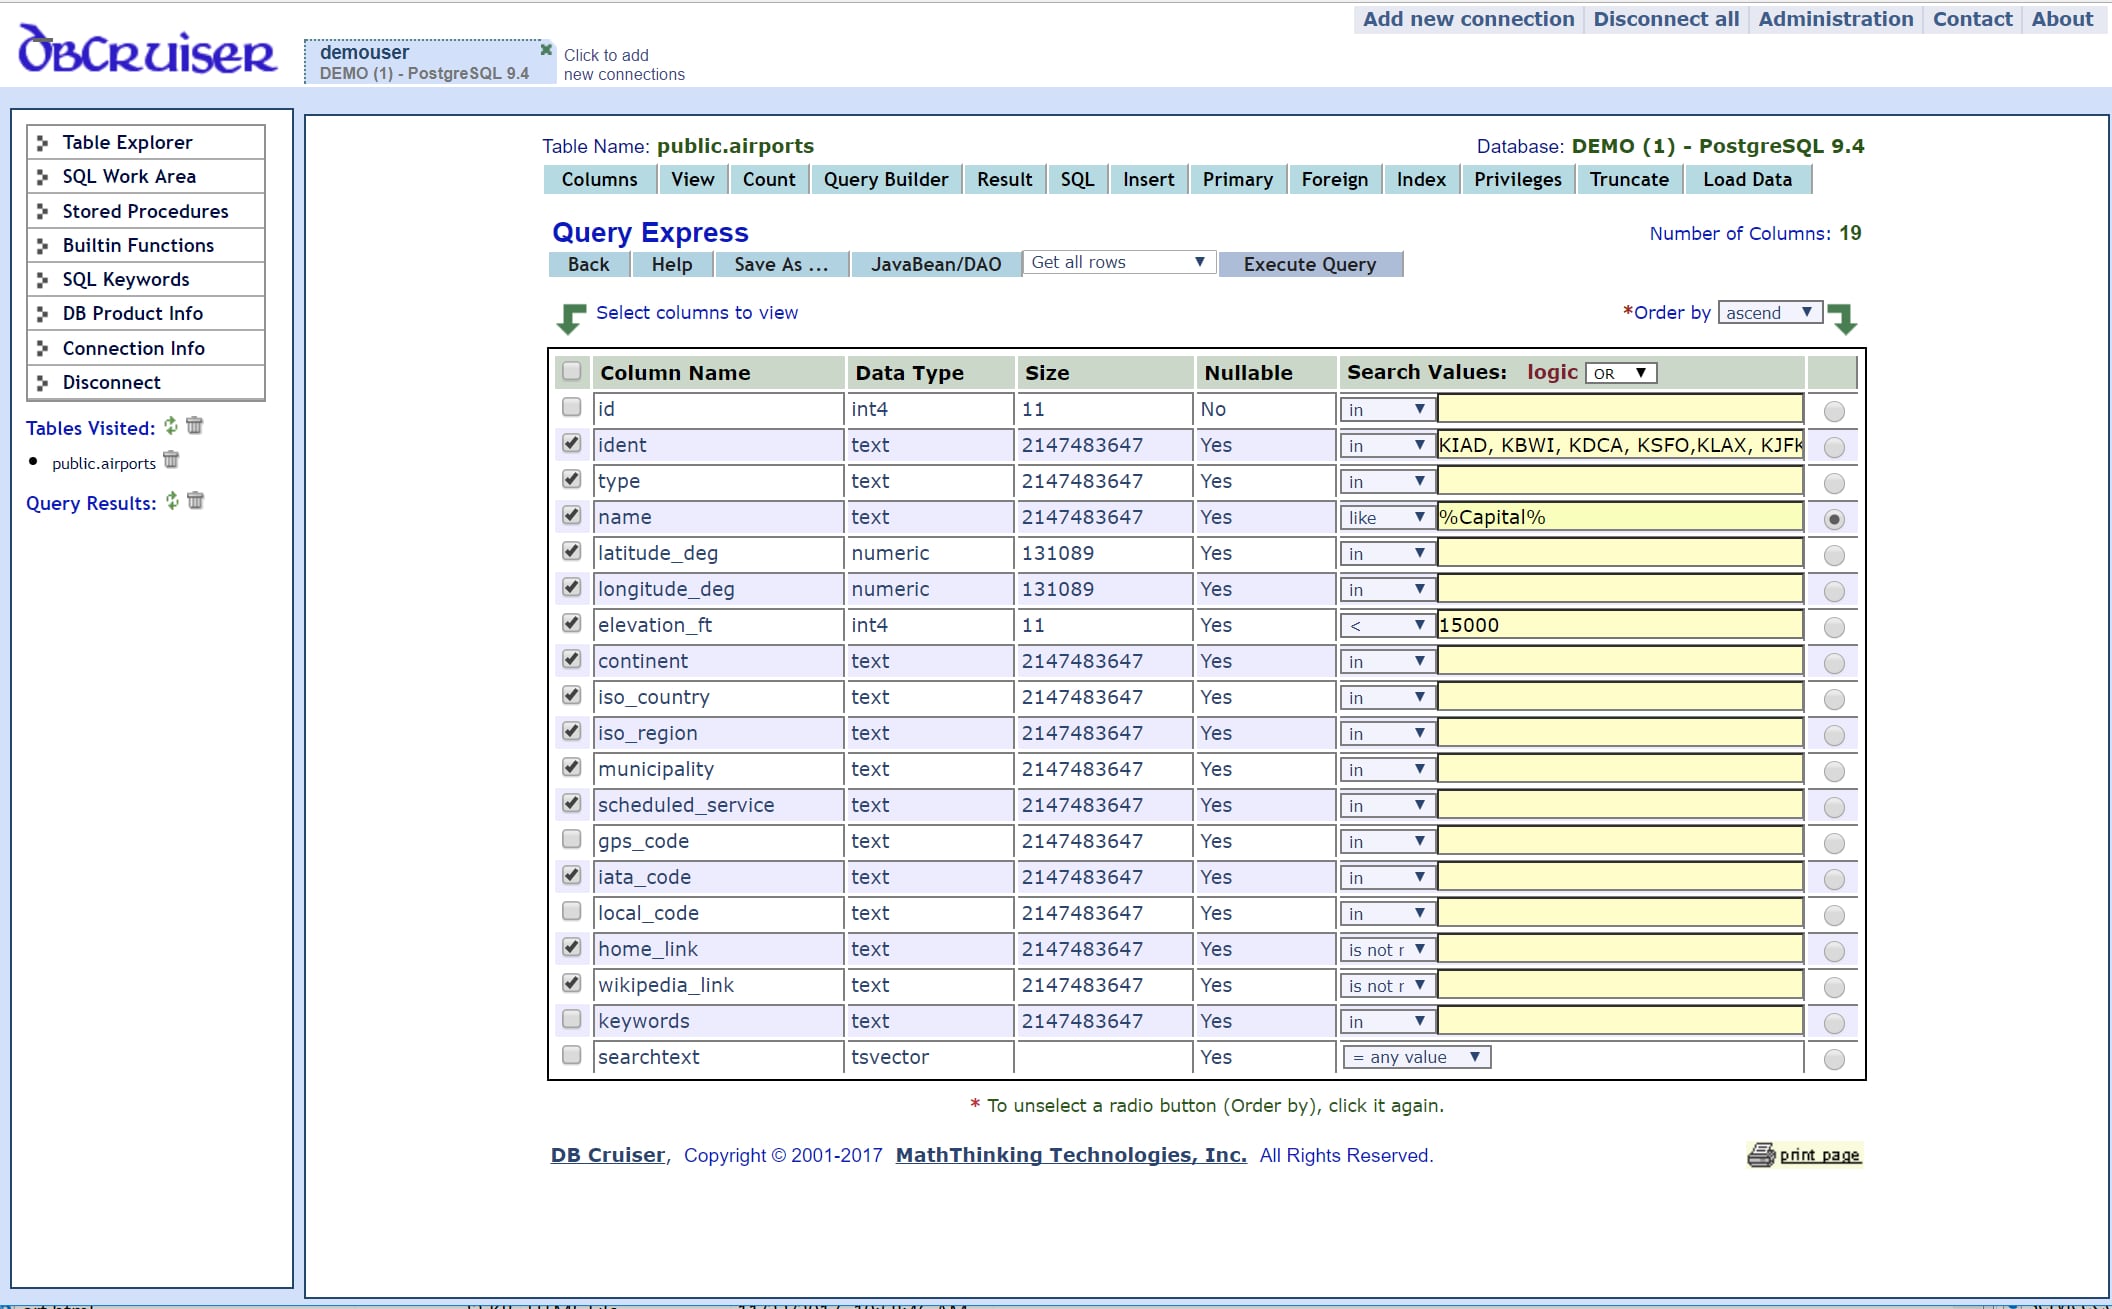 click the image above to view a larger one
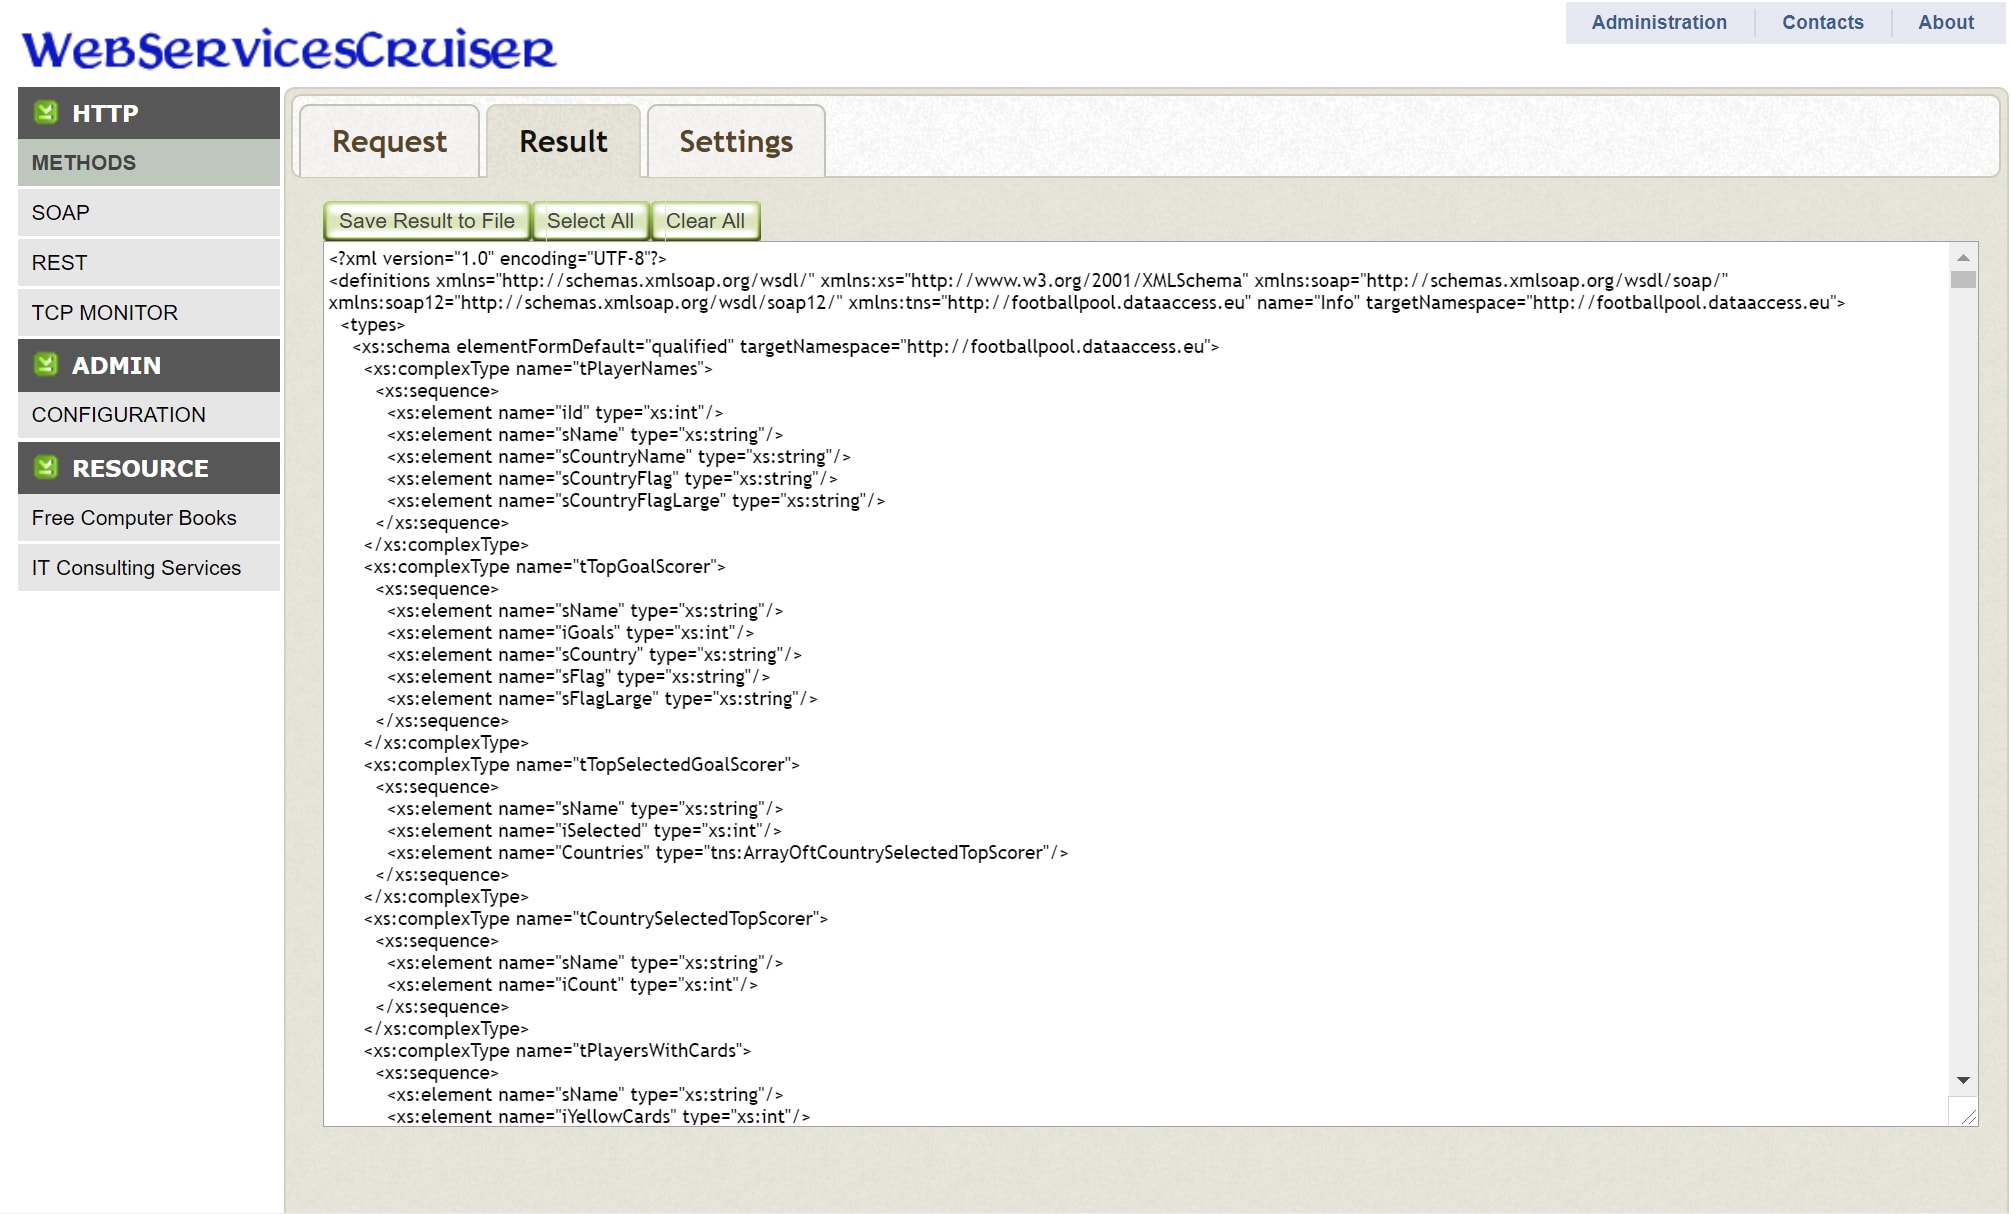
Web Services Cruiser
WWeb Services Cruiser is a leading web-based testing and monitoring tool for web services and HTTP methods. It is the swiss army knife of testing and monitoring. There are many ways to use it. Here are some typical usages:
- Managing all your request URLs at one centralized place.
- Managing all your testing/monitoring input files at one centralized place.
- Monitoring web services in production in just few mouse clicks
- Testing web services and HTTP methods in just few mouse clicks
- Supports all HTTP methods (GET, POST, PUT, DELETE, HEAD, OPTIONS, and TRACE).
- Multiple execution of the same request, both sequentially and concurrently.
 click the image above to view a larger one
Web Services Cruiser